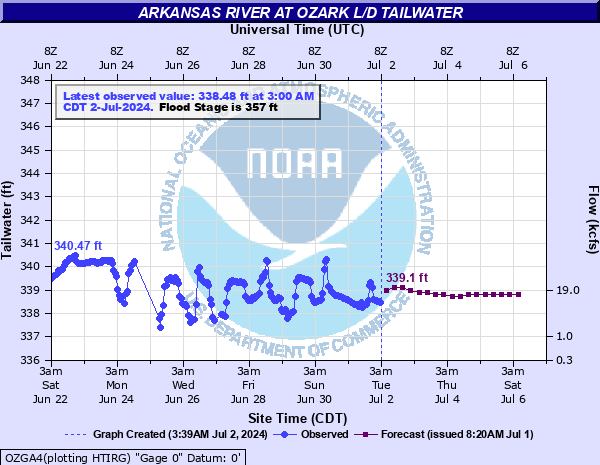
Arkansas River at Ozark L/D Tailwater
Critical Stages
355.5' - Action
357' - Flood
363' - Moderate
365' - Major
Latest Observation
Updated: 9:00 PM CST 12/14/25
Status: No Flooding
Stage: 338.49 ft
Flow: 12.6 kcfs
Forecast
| Time | Stage (ft) | Flow (kcfs) |
|---|---|---|
| 12 AM 12/15 | 338.4 | 11.7 |
| 6 AM 12/15 | 338.4 | 11.7 |
| 12 PM 12/15 | 338.4 | 11.7 |
| 6 PM 12/15 | 338.4 | 11.7 |
| 12 AM 12/16 | 338.4 | 11.7 |
| 6 AM 12/16 | 338.5 | 12.7 |
| 12 PM 12/16 | 338.6 | 13.8 |
| 6 PM 12/16 | 338.6 | 13.8 |
| 12 AM 12/17 | 338.6 | 13.8 |
| 6 AM 12/17 | 338.7 | 14.9 |
| 12 PM 12/17 | 338.7 | 14.9 |
| 6 PM 12/17 | 338.7 | 14.9 |
| 12 AM 12/18 | 338.7 | 14.9 |
| 6 AM 12/18 | 338.6 | 13.8 |
| 12 PM 12/18 | 338.5 | 12.7 |
| 6 PM 12/18 | 338.5 | 12.7 |
| 12 AM 12/19 | 338.5 | 12.7 |
| 6 AM 12/19 | 338.4 | 11.7 |
| Time | Stage (ft) | Flow (kcfs) |
|---|---|---|
| 9:00 PM 12/14 | 338.49 | 12.6 |
| 8:00 PM 12/14 | 338.6 | 13.8 |
| 7:00 PM 12/14 | 338.63 | 14.1 |
| 6:00 PM 12/14 | 338.58 | 13.6 |
| 5:00 PM 12/14 | 338.42 | 11.9 |
| 4:00 PM 12/14 | 337.68 | 3.69 |
| 3:00 PM 12/14 | 337.11 | 1.24 |
| 2:00 PM 12/14 | 336.99 | 0.987 |
| 1:00 PM 12/14 | 337.18 | 1.41 |
| 12:00 PM 12/14 | 337.67 | 3.62 |
| 11:00 AM 12/14 | 339.11 | 20.1 |
| 10:00 AM 12/14 | 339.37 | 23 |
| 9:00 AM 12/14 | 339.3 | 22.1 |
| 8:00 AM 12/14 | 339.27 | 21.8 |
| 7:00 AM 12/14 | 339.2 | 21 |
| 6:00 AM 12/14 | 339.14 | 20.4 |
| 5:00 AM 12/14 | 338.52 | 12.9 |
| 4:00 AM 12/14 | 338.33 | 11.1 |
| 3:00 AM 12/14 | 338.25 | 10.4 |
| 2:00 AM 12/14 | 337.87 | 5.32 |
| 1:00 AM 12/14 | 338.03 | 7.22 |
| 12:00 AM 12/14 | 337.59 | 3.11 |
| 11:00 PM 12/13 | 337.77 | 4.39 |
| 10:00 PM 12/13 | 337.9 | 5.63 |
| 9:00 PM 12/13 | 338.34 | 11.2 |
| 8:00 PM 12/13 | 338.47 | 12.4 |
| 7:00 PM 12/13 | 338.52 | 12.9 |
| 6:00 PM 12/13 | 338.51 | 12.8 |
| 5:00 PM 12/13 | 338.49 | 12.6 |
| 4:00 PM 12/13 | 338.47 | 12.4 |
377' -
this is the critical stage for the McLean Bottom Levee. The Highway 23 bridge approach is inundated in Ozark. Numerous roads near the river are impassable. This is an extremely dangerous and life threatening situation.
373' -
this is the critical stage for the Lower Hartman Bottom Levee. Water covers lanes on the Highway 23 bridge approach in Ozark. Numerous roads near the river are impassable. This is an extremely dangerous and life threatening situation.
370' -
this is the highest stage experienced since the completion of the navigation system in 1969. Highways 309 and 288 northwest of Paris in Logan County are inundated by backwater up Six Mile Creek. Backwater flooding spreads westward into Franklin County. This will exceed the December 29, 2015 flood when the river crested at 369.07 feet. This is an extremely dangerous and life threatening situation.
367' -
Highways 309 and 288 northwest of Paris in Logan County are inundated by backwater up Six Mile Creek. Backwater flooding spreads westward into Franklin County at higher stages. This will approach the December 29, 2015 flood when the river crested at 369.07 feet. This is an extremely dangerous and life threatening situation.
365' -
County Roads 228 and 4 south of Coal Hill in Johnson County are inundated. Roads northeast of Scranton in Logan County are inundated by backwater up Cane Creek. This is an extremely dangerous and life threatening situation.
363' -
patrolling of McLean Bottom Levee in Logan County and Lower Hartman Levee in Johnson County begins. Flooding spreads over more than 4,000 acres in Franklin and Logan Counties. Numerous gas fields are flooded. Some agricultural lands in Johnson County also are flooded.
360' -
flooding spreads over more than 4,000 acres in Franklin and Logan Counties. Numerous gas fields are flooded. Some agricultural lands in Johnson County also are flooded.
357' -
flooding affects agricultural use lands along the river downstream of the lock and dam in Franklin County. Gas fields are also subject to flooding downstream. Equipment and livestock should be moved to higher ground. North 5th Street in Logan County near the Six Mile Levee begins to flood and may cut off access to a nearby residence.
355.5' -
the river remains in its banks, but access to Okane Island may be cut off.
| Date | Stage (ft) |
|---|---|
| May 13, 1943 | 375.5 |
| May 30, 2019 | 374.99 |
| Jun 2, 2019 | 374.95 |
| May 6, 1990 | 370 |
| Dec 29, 2015 | 369.07 |
| Oct 9, 1986 | 368.5 |
| May 27, 2015 | 367.71 |
| Jun 1, 2015 | 367.41 |
| Nov 25, 1973 | 366.3 |
| Jun 15, 1995 | 364 |
| May 11, 2015 | 363.77 |
| May 12, 1993 | 363.7 |
| Apr 11, 2008 | 363.2 |
| Apr 26, 2011 | 363.03 |
| Apr 29, 2021 | 362.78 |
| May 7, 2022 | 362.1 |
| Mar 20, 2008 | 362.07 |
| Jun 25, 2019 | 361.99 |
| Dec 16, 1992 | 361.5 |
| Jan 6, 1998 | 361.31 |
Data provided by the National Weather Service.