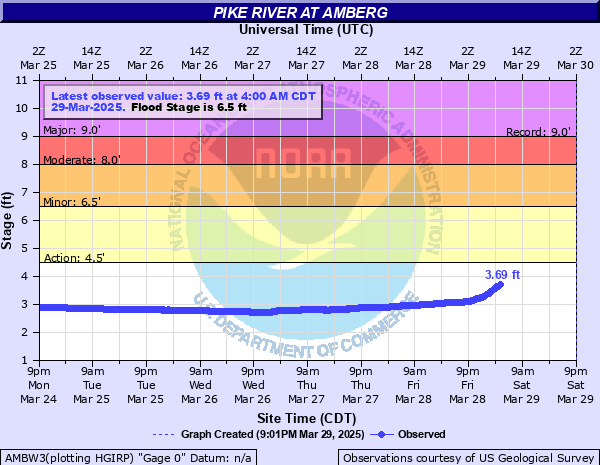
Pike River at Amberg
Critical Stages
4.5' - Action
6.5' - Flood
8' - Moderate
9' - Major
Latest Observation
Updated: 2:00 PM CST 12/15/25
Status: No Flooding
Stage: 2.77 ft
Flow: 0.153 kcfs
Forecast
Forecast not available for this location.
| Time | Stage (ft) | Flow (kcfs) |
|---|---|---|
| 2:00 PM 12/15 | 2.77 | 0.153 |
| 1:45 PM 12/15 | 2.77 | 0.153 |
| 1:30 PM 12/15 | 2.77 | 0.153 |
| 1:15 PM 12/15 | 2.76 | 0.151 |
| 1:00 PM 12/15 | 2.76 | 0.151 |
| 12:45 PM 12/15 | 2.76 | 0.151 |
| 12:30 PM 12/15 | 2.76 | 0.151 |
| 12:15 PM 12/15 | 2.76 | 0.151 |
| 12:00 PM 12/15 | 2.76 | 0.151 |
| 11:45 AM 12/15 | 2.76 | 0.151 |
| 11:30 AM 12/15 | 2.75 | 0.15 |
| 11:15 AM 12/15 | 2.75 | 0.15 |
| 11:00 AM 12/15 | 2.75 | 0.15 |
| 10:45 AM 12/15 | 2.75 | 0.15 |
| 10:30 AM 12/15 | 2.75 | 0.15 |
| 10:15 AM 12/15 | 2.74 | 0.148 |
| 10:00 AM 12/15 | 2.74 | 0.148 |
| 9:45 AM 12/15 | 2.74 | 0.148 |
| 9:30 AM 12/15 | 2.73 | 0.147 |
| 9:15 AM 12/15 | 2.74 | 0.148 |
| 9:00 AM 12/15 | 2.73 | 0.147 |
| 8:45 AM 12/15 | 2.73 | 0.147 |
| 8:30 AM 12/15 | 2.73 | 0.147 |
| 8:15 AM 12/15 | 2.73 | 0.147 |
| 8:00 AM 12/15 | 2.73 | 0.147 |
| 7:45 AM 12/15 | 2.73 | 0.147 |
| 7:30 AM 12/15 | 2.73 | 0.147 |
| 7:15 AM 12/15 | 2.73 | 0.147 |
| 7:00 AM 12/15 | 2.72 | 0.145 |
| 6:45 AM 12/15 | 2.72 | 0.145 |
10' -
Water is flowing over the Highway V bridge. Several homes affected by flood water.
9.5' -
Water is flowing over the Highway V bridge. Several homes in the the area may be affected by floodwater.
8' -
Flooding is mainly confined to areas west of Amberg. Water is touching the bottom of the Highway V bridge. Moderate lowland flooding is likely occurring. Water is approaching homes in the area.
6.5' -
Flooding affects are mainly confined to areas west of Amberg along Highway V. Water covers an adjacent park near the the Highway V bridge. A foot bridge near the bridge may be under several feet of water.
4.5' -
There is minor flooding of wooded lowland.
| Date | Stage (ft) |
|---|---|
| Apr 10, 1922 | 9 |
| Apr 14, 2023 | 7.25 |
| May 7, 1960 | 7 |
| Apr 18, 2019 | 6.92 |
| Mar 31, 2020 | 6.69 |
| May 19, 2017 | 6.53 |
| Mar 18, 2016 | 6.23 |
| Apr 14, 2022 | 6.2 |
| Apr 20, 2008 | 6.12 |
| Apr 14, 2002 | 6.11 |
| May 25, 2004 | 6.01 |
| Mar 27, 2007 | 5.87 |
| Apr 12, 2015 | 5.73 |
| Dec 20, 2015 | 5.4 |
| Apr 13, 2021 | 4.91 |
Data provided by the National Weather Service.