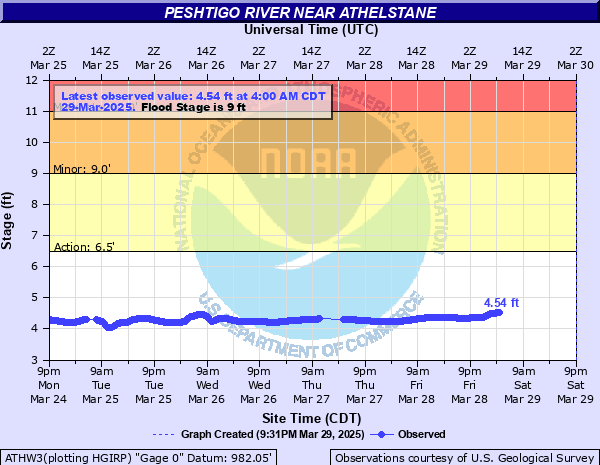
Peshtigo River near Athelstane
Critical Stages
6.5' - Action
9' - Flood
11' - Moderate
12' - Major
Latest Observation
Updated: 2:00 PM CST 12/15/25
Status: No Flooding
Stage: 4.22 ft
Flow: 0.326 kcfs
Forecast
Forecast not available for this location.
| Time | Stage (ft) | Flow (kcfs) |
|---|---|---|
| 2:00 PM 12/15 | 4.22 | 0.326 |
| 1:45 PM 12/15 | 4.22 | 0.326 |
| 1:30 PM 12/15 | 4.22 | 0.326 |
| 1:15 PM 12/15 | 4.22 | 0.326 |
| 1:00 PM 12/15 | 4.21 | 0.322 |
| 12:45 PM 12/15 | 4.21 | 0.322 |
| 12:30 PM 12/15 | 4.21 | 0.322 |
| 12:15 PM 12/15 | 4.2 | 0.318 |
| 12:00 PM 12/15 | 4.2 | 0.318 |
| 11:45 AM 12/15 | 4.19 | 0.314 |
| 11:30 AM 12/15 | 4.19 | 0.314 |
| 11:15 AM 12/15 | 4.18 | 0.31 |
| 11:00 AM 12/15 | 4.18 | 0.31 |
| 10:45 AM 12/15 | 4.17 | 0.306 |
| 10:30 AM 12/15 | 4.17 | 0.306 |
| 10:15 AM 12/15 | 4.16 | 0.302 |
| 10:00 AM 12/15 | 4.16 | 0.302 |
| 9:45 AM 12/15 | 4.16 | 0.302 |
| 9:30 AM 12/15 | 4.16 | 0.302 |
| 9:15 AM 12/15 | 4.15 | 0.298 |
| 9:00 AM 12/15 | 4.15 | 0.298 |
| 8:45 AM 12/15 | 4.15 | 0.298 |
| 8:30 AM 12/15 | 4.15 | 0.298 |
| 8:15 AM 12/15 | 4.15 | 0.298 |
| 8:00 AM 12/15 | 4.14 | 0.294 |
| 7:45 AM 12/15 | 4.14 | 0.294 |
| 7:30 AM 12/15 | 4.14 | 0.294 |
| 7:15 AM 12/15 | 4.14 | 0.294 |
| 7:00 AM 12/15 | 4.14 | 0.294 |
| 6:45 AM 12/15 | 4.15 | 0.298 |
12' -
Flows are likely very fast. Water is nearing the bottom of the Highway C bridge. Some structures along the river are likely surrounded by several feet of water.
11' -
Floodwater is surrounding structures downstream of the Highway C bridge.
9' -
Water rises to backyards of area homes.
6.5' -
There is minor lowland flooding.
6' -
Rapids upstream can be very dangerous due to debris from sides of the river working through the various rapids.
5' -
Ideal stage for rafting for this section of the river is between 5.0 and 5.5 feet.
3.8' -
Water stages are so low that stretches of river are walked through. This stage compares to a staff gage reading on the Highway C bridge at minus 0.2 feet.
| Date | Stage (ft) |
|---|---|
| Apr 18, 2023 | 8.38 |
| Apr 21, 2019 | 7.26 |
| Apr 17, 2002 | 7.17 |
| Jun 14, 2017 | 6.98 |
| Apr 22, 2008 | 6.87 |
| Apr 5, 2020 | 6.8 |
| May 2, 2013 | 6.68 |
| Apr 13, 2001 | 6.5 |
| Jun 24, 2011 | 6.38 |
| May 29, 2015 | 6.26 |
| Mar 18, 2016 | 6.24 |
Data provided by the National Weather Service.