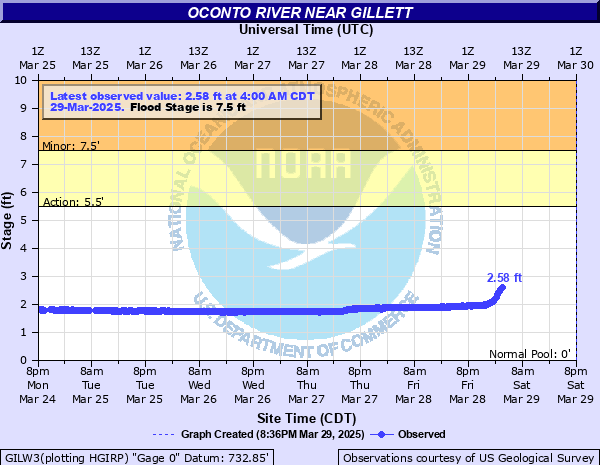
Oconto River near Gillett
Critical Stages
5.5' - Action
7.5' - Flood
10.5' - Moderate
12.5' - Major
Latest Observation
Updated: 2:30 PM CST 12/15/25
Status: No Flooding
Stage: 2.38 ft
Flow: 0.868 kcfs
Forecast
Forecast not available for this location.
| Time | Stage (ft) | Flow (kcfs) |
|---|---|---|
| 2:30 PM 12/15 | 2.38 | 0.868 |
| 2:15 PM 12/15 | 2.37 | 0.864 |
| 2:00 PM 12/15 | 2.37 | 0.864 |
| 1:45 PM 12/15 | 2.38 | 0.868 |
| 1:30 PM 12/15 | 2.38 | 0.868 |
| 1:15 PM 12/15 | 2.37 | 0.864 |
| 1:00 PM 12/15 | 2.37 | 0.864 |
| 12:45 PM 12/15 | 2.37 | 0.864 |
| 12:30 PM 12/15 | 2.36 | 0.86 |
| 12:15 PM 12/15 | 2.36 | 0.86 |
| 12:00 PM 12/15 | 2.35 | 0.856 |
| 11:45 AM 12/15 | 2.35 | 0.856 |
| 11:30 AM 12/15 | 2.34 | 0.852 |
| 11:15 AM 12/15 | 2.33 | 0.848 |
| 11:00 AM 12/15 | 2.33 | 0.848 |
| 10:45 AM 12/15 | 2.32 | 0.844 |
| 10:30 AM 12/15 | 2.32 | 0.844 |
| 10:15 AM 12/15 | 2.31 | 0.84 |
| 10:00 AM 12/15 | 2.31 | 0.84 |
| 9:45 AM 12/15 | 2.3 | 0.836 |
| 9:30 AM 12/15 | 2.3 | 0.836 |
| 9:15 AM 12/15 | 2.3 | 0.836 |
| 9:00 AM 12/15 | 2.3 | 0.836 |
| 8:45 AM 12/15 | 2.3 | 0.836 |
| 8:30 AM 12/15 | 2.3 | 0.836 |
| 8:15 AM 12/15 | 2.31 | 0.84 |
| 8:00 AM 12/15 | 2.31 | 0.84 |
| 7:45 AM 12/15 | 2.31 | 0.84 |
| 7:30 AM 12/15 | 2.31 | 0.84 |
| 7:15 AM 12/15 | 2.31 | 0.84 |
13' -
The Highway BB and Highway 32 bridges may be impacted by high water.
11.5' -
Water touches the lowest portion of the Highway BB bridge and the Highway 32 bridge. Sportsmans Park in the town of Pulcifer is flooded.
7.5' -
There is widespread flooding of lowland and agricultural land. Water spreads into Sportsmans Park in the town of Pulcifer. Water approaches homes downstream of the gauge southwest of Gillett.
6.5' -
Water approaches homes just upstream of the Highway 32 bridge. Widespread lowland flooding is occurring. A river walkway in Suring may be flooded.
4.5' -
There is minor lowland flooding in the Gillett vicinity. Minor lowland flooding may also be affecting upstream areas toward Suring.
| Date | Stage (ft) |
|---|---|
| Apr 10, 1922 | 11.2 |
| Mar 15, 1953 | 10.5 |
| Apr 2, 1952 | 9.95 |
| Mar 10, 1973 | 9.08 |
| Apr 16, 1991 | 8.2 |
| Apr 19, 2019 | 7.54 |
| Jan 2, 1993 | 7.43 |
| Nov 8, 1992 | 7.42 |
| Mar 16, 1990 | 6.98 |
| Mar 31, 2020 | 6.23 |
| Mar 26, 2022 | 6.23 |
| Apr 2, 2005 | 6.15 |
| Mar 13, 2021 | 5.72 |
| May 2, 2002 | 5.55 |
| Mar 19, 1998 | 5.48 |
| Apr 5, 2023 | 5.28 |
| Jun 24, 2011 | 5.12 |
| Apr 25, 2018 | 4.45 |
Data provided by the National Weather Service.