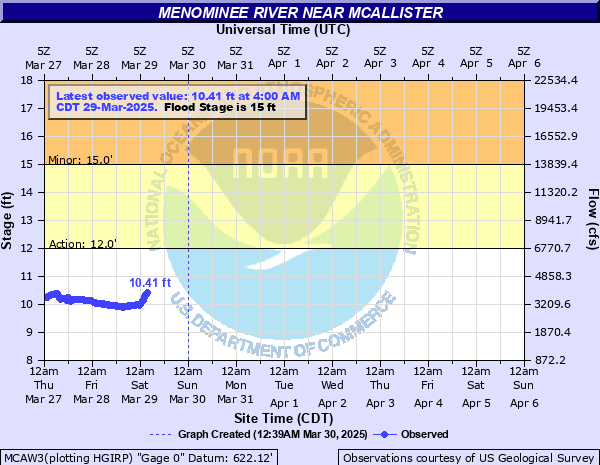
Menominee River near McAllister
Critical Stages
12' - Action
15' - Flood
18' - Moderate
19' - Major
Latest Observation
Updated: 2:00 PM CST 12/15/25
Status: No Flooding
Stage: 10.06 ft
Flow: 3.23 kcfs
Forecast
Forecast not available for this location.
| Time | Stage (ft) | Flow (kcfs) |
|---|---|---|
| 2:00 PM 12/15 | 10.06 | 3.23 |
| 1:45 PM 12/15 | 10.06 | 3.23 |
| 1:30 PM 12/15 | 10.06 | 3.23 |
| 1:15 PM 12/15 | 10.05 | 3.21 |
| 1:00 PM 12/15 | 10.05 | 3.21 |
| 12:45 PM 12/15 | 10.05 | 3.21 |
| 12:30 PM 12/15 | 10.06 | 3.23 |
| 12:15 PM 12/15 | 10.06 | 3.23 |
| 12:00 PM 12/15 | 10.06 | 3.23 |
| 11:45 AM 12/15 | 10.07 | 3.24 |
| 11:30 AM 12/15 | 10.07 | 3.24 |
| 11:15 AM 12/15 | 10.07 | 3.24 |
| 11:00 AM 12/15 | 10.07 | 3.24 |
| 10:45 AM 12/15 | 10.06 | 3.23 |
| 10:30 AM 12/15 | 10.05 | 3.21 |
| 10:15 AM 12/15 | 10.05 | 3.21 |
| 10:00 AM 12/15 | 10.04 | 3.2 |
| 9:45 AM 12/15 | 10.03 | 3.18 |
| 9:30 AM 12/15 | 10.03 | 3.18 |
| 9:15 AM 12/15 | 10.02 | 3.17 |
| 9:00 AM 12/15 | 10 | 3.14 |
| 8:45 AM 12/15 | 9.99 | 3.12 |
| 8:30 AM 12/15 | 9.98 | 3.1 |
| 8:15 AM 12/15 | 9.97 | 3.09 |
| 8:00 AM 12/15 | 9.96 | 3.08 |
| 7:45 AM 12/15 | 9.95 | 3.06 |
| 7:30 AM 12/15 | 9.92 | 3.02 |
| 7:15 AM 12/15 | 9.91 | 3 |
| 7:00 AM 12/15 | 9.89 | 2.97 |
| 6:45 AM 12/15 | 9.87 | 2.94 |
19' -
This stage compares to the record flow of 24800 cubic feet per second at White Rapids Dam.
18' -
Floodwaters are covering River Drive and Shore Drive west of Wallace in Menominee County, Michigan andSouth Park Road east of Porterfield in Marinette County. This stage compares to a flow of 24240 cubic feet per second at White Rapids Dam.
16.5' -
Water approaches River Drive and Shore Drive west of Wallace in Menominee County, Michigan. Water approaches South Park Road east of Porterfield.
15' -
Water covers the boat docks near the river gauge and there is extensive flooding of wooded lowland areas.
12' -
There is minor flooding of wooded lowland.
| Date | Stage (ft) |
|---|---|
| May 9, 1960 | 20 |
| Apr 18, 2023 | 18.56 |
| Apr 20, 2002 | 18.33 |
| May 12, 1965 | 18.27 |
| Apr 8, 1986 | 17.95 |
| Apr 15, 1951 | 17.83 |
| Jul 5, 1953 | 17.43 |
| Apr 26, 2019 | 17.31 |
| May 3, 1972 | 17.27 |
| Jun 18, 1981 | 17.23 |
| Jun 3, 1970 | 17.16 |
| Apr 21, 1967 | 16.92 |
| Apr 26, 1975 | 16.82 |
| Apr 30, 1954 | 16.77 |
| May 11, 1950 | 16.7 |
| May 11, 1973 | 16.65 |
| Apr 19, 1971 | 16.63 |
| Apr 25, 1985 | 16.62 |
| Apr 23, 1952 | 15.98 |
| Apr 22, 2004 | 15.95 |
Data provided by the National Weather Service.