« Back to Alamance County Rivers
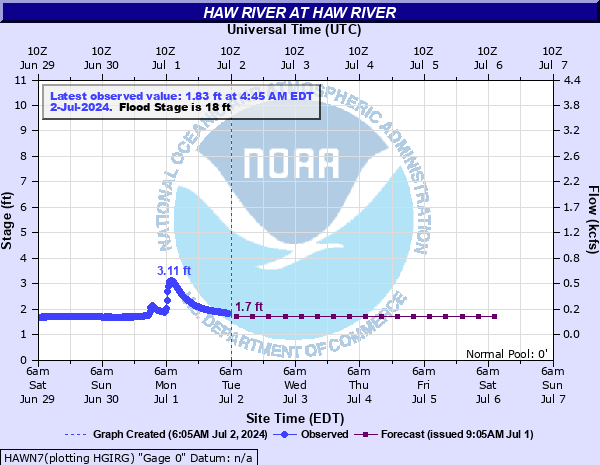
Haw River at Haw River
Critical Stages
16' - Action
18' - Flood
23' - Moderate
27' - Major
Latest Observation
Updated: 6:45 PM EST 12/15/25
Status: No Flooding
Stage: 1.97 ft
Flow: 0.13 kcfs
Forecast
| Time | Stage (ft) | Flow (kcfs) |
|---|---|---|
| 1 AM 12/16 | 2 | 0.137 |
| 7 AM 12/16 | 2 | 0.137 |
| 1 PM 12/16 | 2 | 0.137 |
| 7 PM 12/16 | 2 | 0.137 |
| 1 AM 12/17 | 2 | 0.137 |
| 7 AM 12/17 | 2 | 0.137 |
| 1 PM 12/17 | 2 | 0.137 |
| 7 PM 12/17 | 2 | 0.137 |
| 1 AM 12/18 | 2 | 0.137 |
| 7 AM 12/18 | 2 | 0.137 |
| 1 PM 12/18 | 2 | 0.137 |
| 7 PM 12/18 | 2 | 0.137 |
| 1 AM 12/19 | 2 | 0.137 |
| 7 AM 12/19 | 2 | 0.137 |
| 1 PM 12/19 | 2 | 0.137 |
| 7 PM 12/19 | 2 | 0.137 |
| 1 AM 12/20 | 2 | 0.137 |
| 7 AM 12/20 | 2 | 0.137 |
| Time | Stage (ft) | Flow (kcfs) |
|---|---|---|
| 6:45 PM 12/15 | 1.97 | 0.13 |
| 6:30 PM 12/15 | 1.96 | 0.127 |
| 6:15 PM 12/15 | 1.96 | 0.127 |
| 6:00 PM 12/15 | 1.96 | 0.127 |
| 5:45 PM 12/15 | 1.96 | 0.127 |
| 5:30 PM 12/15 | 1.96 | 0.127 |
| 5:15 PM 12/15 | 1.96 | 0.127 |
| 5:00 PM 12/15 | 1.97 | 0.13 |
| 4:45 PM 12/15 | 1.97 | 0.13 |
| 4:30 PM 12/15 | 1.97 | 0.13 |
| 4:15 PM 12/15 | 1.97 | 0.13 |
| 4:00 PM 12/15 | 1.97 | 0.13 |
| 3:45 PM 12/15 | 1.96 | 0.127 |
| 3:30 PM 12/15 | 1.97 | 0.13 |
| 3:15 PM 12/15 | 1.96 | 0.127 |
| 3:00 PM 12/15 | 1.97 | 0.13 |
| 2:45 PM 12/15 | 1.96 | 0.127 |
| 2:30 PM 12/15 | 1.97 | 0.13 |
| 2:15 PM 12/15 | 1.96 | 0.127 |
| 2:00 PM 12/15 | 1.97 | 0.13 |
| 1:45 PM 12/15 | 1.96 | 0.127 |
| 1:30 PM 12/15 | 1.97 | 0.13 |
| 1:15 PM 12/15 | 1.96 | 0.127 |
| 1:00 PM 12/15 | 1.97 | 0.13 |
| 12:45 PM 12/15 | 1.97 | 0.13 |
| 12:30 PM 12/15 | 1.97 | 0.13 |
| 12:15 PM 12/15 | 1.96 | 0.127 |
| 12:00 PM 12/15 | 1.96 | 0.127 |
| 11:45 AM 12/15 | 1.96 | 0.127 |
| 11:30 AM 12/15 | 1.96 | 0.127 |
30' -
A mill on the left bank begins to flood.
28' -
Flood waters reach the bottom of the bridge across I40.
27' -
Major flooding begins. The town of Haw River begins to flood.
26' -
Trailer homes adjacent to the river and the water treatment plant flood. Evacuations may be necessary.
25.5' -
The water treatment plant building floods.
23' -
Moderate flooding begins. Flooding reaches the base of the water treatment plant building. There is also significant flooding of the Red Slide Park upstream of the Main St. Bridge, and Lang St will be impassable
20' -
There is significant overflow on the right bank opposite the water treatment plant. Water also reaches the Red Slide Park upstream of the Main St. Bridge.
18' -
Minor flooding begins. Overflow begins on both banks at the water treatment plant.
| Date | Stage (ft) |
|---|---|
| Sep 6, 1996 | 32.83 |
| Sep 18, 1945 | 31.1 |
| Sep 26, 1947 | 27.89 |
| Apr 16, 1987 | 27.37 |
| Jun 29, 1995 | 26.5 |
| Sep 17, 2018 | 26.27 |
| Oct 9, 1959 | 26.2 |
| Nov 13, 2018 | 25.62 |
| Oct 16, 1954 | 25.5 |
| Feb 7, 2020 | 24.64 |
| Mar 20, 2003 | 24.55 |
| Aug 28, 1995 | 24.5 |
| Jul 28, 1984 | 24.15 |
| Apr 25, 2017 | 23.4 |
| Apr 22, 1992 | 23.35 |
| Oct 13, 2018 | 23.28 |
| Feb 14, 1984 | 23.27 |
| Mar 30, 1991 | 23.25 |
| Apr 29, 1997 | 22.34 |
| Aug 9, 2024 | 22.32 |
Data provided by the National Weather Service.