« Back to Alcorn County Rivers
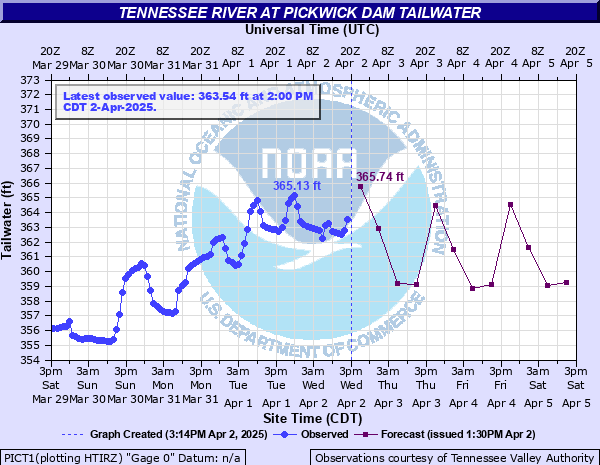
Tennessee River at Pickwick Dam Tailwater
Critical Stages
Action
Flood
Moderate
Major
Latest Observation
Updated: 5:00 PM CST 12/6/25
Status: Not Defined
Stage: 360.75 ft
Flow: -999 kcfs
Forecast
| Time | Stage (ft) | Flow (kcfs) |
|---|---|---|
| 12 AM 12/7 | 359.92 | -999 |
| 6 AM 12/7 | 359.91 | -999 |
| 12 PM 12/7 | 359.93 | -999 |
| 6 PM 12/7 | 359.95 | -999 |
| 12 AM 12/8 | 359.93 | -999 |
| 6 AM 12/8 | 360.31 | -999 |
| 12 PM 12/8 | 360.36 | -999 |
| 6 PM 12/8 | 360.39 | -999 |
| 12 AM 12/9 | 360.38 | -999 |
| 6 AM 12/9 | 360.37 | -999 |
| 12 PM 12/9 | 360.38 | -999 |
| 6 PM 12/9 | 360.4 | -999 |
| 12 AM 12/10 | 360.38 | -999 |
| 6 AM 12/10 | 360.38 | -999 |
| 12 PM 12/10 | 360.39 | -999 |
| 6 PM 12/10 | 360.4 | -999 |
| 12 AM 12/11 | 360.39 | -999 |
| 6 AM 12/11 | 359.02 | -999 |
| 12 PM 12/11 | 358.86 | -999 |
| 6 PM 12/11 | 358.82 | -999 |
| 12 AM 12/12 | 358.81 | -999 |
| 6 AM 12/12 | 357.66 | -999 |
| 12 PM 12/12 | 357.54 | -999 |
| 6 PM 12/12 | 357.55 | -999 |
| 12 AM 12/13 | 356.19 | -999 |
| 6 AM 12/13 | 356.59 | -999 |
| 12 PM 12/13 | 356.64 | -999 |
| Time | Stage (ft) | Flow (kcfs) |
|---|---|---|
| 6:00 PM 12/6 | 360.59 | -999 |
| 5:00 PM 12/6 | 360.75 | -999 |
| 4:00 PM 12/6 | 360.52 | -999 |
| 3:00 PM 12/6 | 360.48 | -999 |
| 2:00 PM 12/6 | 360.47 | -999 |
| 1:00 PM 12/6 | 360.44 | -999 |
| 12:00 PM 12/6 | 360.52 | -999 |
| 11:00 AM 12/6 | 360.39 | -999 |
| 10:00 AM 12/6 | 360.3 | -999 |
| 9:00 AM 12/6 | 360.11 | -999 |
| 8:00 AM 12/6 | 359.97 | -999 |
| 7:00 AM 12/6 | 359.84 | -999 |
| 6:00 AM 12/6 | 359.58 | -999 |
| 5:00 AM 12/6 | 358.47 | -999 |
| 4:00 AM 12/6 | 357.01 | -999 |
| 3:00 AM 12/6 | 357.03 | -999 |
| 2:00 AM 12/6 | 357.21 | -999 |
| 1:00 AM 12/6 | 357.5 | -999 |
| 12:00 AM 12/6 | 357.9 | -999 |
| 11:00 PM 12/5 | 359.48 | -999 |
| 10:00 PM 12/5 | 359.63 | -999 |
| 9:00 PM 12/5 | 360.48 | -999 |
| 8:00 PM 12/5 | 360.45 | -999 |
| 7:00 PM 12/5 | 360.43 | -999 |
| 6:00 PM 12/5 | 360.3 | -999 |
| 5:00 PM 12/5 | 359.41 | -999 |
| 4:00 PM 12/5 | 359.39 | -999 |
| 3:00 PM 12/5 | 359.41 | -999 |
| 2:00 PM 12/5 | 359.58 | -999 |
| 1:00 PM 12/5 | 359.87 | -999 |
399' -
Intersection of Wharf Road and Power Lane is flooding.
398' -
Parking lot right by the dam is flooding by the rest rooms on the north side of the river.
397' -
Intersection of Wharf Road and the road to the east end of the east parking lot of Pickwick Dam is flooding and stopping further evacuations.
391' -
Intersection of Botel Llane and Bells Road is flooding northeast of the botel, effectively stopping evacuations from Arnold Lane and Bells Road.
390' -
Intersection of Botel Lane and Wharf Road is flooding. Homesteads on riverbank of Shiloh Shores are going under water.
389' -
Pickwick Campground is flooding.
385' -
Federal Road going to Childer's Hill is flooding.
384' -
Botel Lane is flooding north of Wharf Road.
382' -
Road to Narrows Subdivision off Leith Road begins to flood. Boat parking area south of the TVA Campground begins to flood.
381' -
Pipeline Road is flooding.
380' -
Federal Road floods just north of Hamburg. Boat parking area south of the botel begins to flood.
376' -
Federal Road is flooding at Lick Creek. North leg of Nixon Loop floods at Hatley Creek. Homesteads on north end of Arnold Road are beginning to flood.
| Date | Stage (ft) |
|---|---|
| Mar 19, 1973 | 399.6 |
| Feb 25, 2019 | 399.17 |
| Dec 25, 1990 | 395.19 |
| Dec 18, 2004 | 394.76 |
| Feb 20, 1991 | 394.06 |
| May 11, 2003 | 393.88 |
| Jan 12, 1974 | 393.3 |
| Mar 23, 1980 | 392.6 |
| May 10, 1984 | 391.18 |
| Mar 28, 1994 | 391 |
| May 22, 1983 | 390.6 |
| Jan 28, 2002 | 389.96 |
| Jan 12, 1968 | 388.5 |
| Apr 7, 1977 | 388.3 |
| Dec 31, 1969 | 387.8 |
| Dec 24, 1967 | 387 |
| Jan 13, 1989 | 386.87 |
| Mar 5, 1997 | 386.61 |
| Dec 17, 1972 | 386.3 |
| Mar 7, 1979 | 385.4 |
Data provided by the National Weather Service.