Cattaraugus Creek at Gowanda
Critical Stages
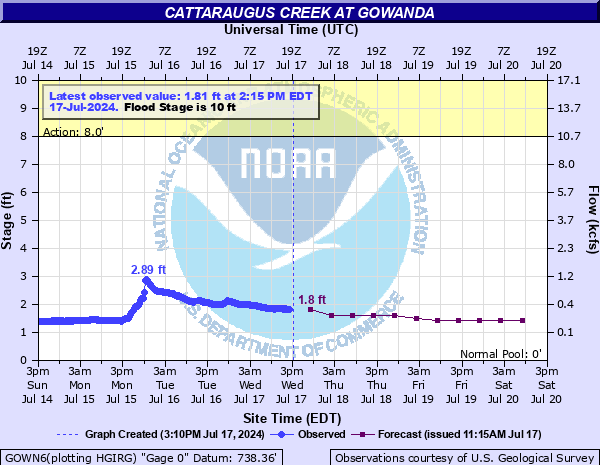
8' - Action
10' - Flood
12' - Moderate
14' - Major
Latest Observation
Updated: 10:15 AM EST 12/12/25
Status: No Flooding
Stage: 2.14 ft
Flow: 0.531 kcfs
Forecast
| Time | Stage (ft) | Flow (kcfs) |
|---|---|---|
| 1 PM 12/12 | 1.9 | 0.399 |
| 7 PM 12/12 | 1.9 | 0.399 |
| 1 AM 12/13 | 1.9 | 0.399 |
| 7 AM 12/13 | 1.8 | 0.35 |
| 1 PM 12/13 | 1.8 | 0.35 |
| 7 PM 12/13 | 1.8 | 0.35 |
| 1 AM 12/14 | 1.8 | 0.35 |
| 7 AM 12/14 | 1.8 | 0.35 |
| Time | Stage (ft) | Flow (kcfs) |
|---|---|---|
| 10:15 AM 12/12 | 2.14 | 0.531 |
| 10:00 AM 12/12 | 2.15 | 0.537 |
| 9:45 AM 12/12 | 2.15 | 0.537 |
| 9:30 AM 12/12 | 2.16 | 0.543 |
| 9:15 AM 12/12 | 2.16 | 0.543 |
| 9:00 AM 12/12 | 2.16 | 0.543 |
| 8:45 AM 12/12 | 2.16 | 0.543 |
| 8:30 AM 12/12 | 2.16 | 0.543 |
| 8:15 AM 12/12 | 2.17 | 0.549 |
| 8:00 AM 12/12 | 2.18 | 0.555 |
| 7:45 AM 12/12 | 2.17 | 0.549 |
| 7:30 AM 12/12 | 2.18 | 0.555 |
| 7:15 AM 12/12 | 2.18 | 0.555 |
| 7:00 AM 12/12 | 2.19 | 0.561 |
| 6:45 AM 12/12 | 2.19 | 0.561 |
| 6:30 AM 12/12 | 2.2 | 0.567 |
| 6:15 AM 12/12 | 2.2 | 0.567 |
| 6:00 AM 12/12 | 2.21 | 0.573 |
| 5:45 AM 12/12 | 2.21 | 0.573 |
| 5:30 AM 12/12 | 2.22 | 0.579 |
| 5:15 AM 12/12 | 2.22 | 0.579 |
| 5:01 AM 12/12 | 2.23 | 0.586 |
| 5:00 AM 12/12 | 2.23 | 0.586 |
| 4:46 AM 12/12 | 2.24 | 0.592 |
| 4:45 AM 12/12 | 2.24 | 0.592 |
| 4:31 AM 12/12 | 2.24 | 0.592 |
| 4:30 AM 12/12 | 2.24 | 0.592 |
| 4:16 AM 12/12 | 2.24 | 0.592 |
| 4:15 AM 12/12 | 2.24 | 0.592 |
| 4:00 AM 12/12 | 2.25 | 0.599 |
14' -
Major flood, extreme residential and commercial flooding downstream from Gowanda. Also some flooding 1 to 2 miles upstream. Serious flooding possible near Thatcher Brook in Gowanda and Sunset Bay near Lake Erie.
12' -
Moderate flood, residential flooding begins downstream of Gowanda, especially on the right bank. Flooding also possible at Sunset Bay on Lake Erie and along Thatcher Brook in Gowanda.
10' -
Flood stage, flooding along right bank a half mile to a mile downstream from Gowanda, mostly in industrial and commercial areas. Watch for developing problems along Thatcher Creek in Gowanda and at Sunset Bay at the mouth near Lake Erie.
8' -
Action stage, water begins to spill over right bank near the sewage disposal plant, about 1 mile downstream from Gowanda.
| Date | Stage (ft) |
|---|---|
| Mar 7, 1956 | 14.14 |
| Sep 14, 1979 | 13.99 |
| Mar 17, 1942 | 13.62 |
| Aug 10, 2009 | 13.47 |
| Jan 19, 1996 | 13.02 |
| Sep 28, 1967 | 12.85 |
| Jan 22, 1959 | 12.44 |
| Jun 23, 1972 | 12.17 |
| Jun 26, 1998 | 12.02 |
| Apr 5, 1947 | 11.94 |
| Jul 17, 2021 | 11.7 |
| Jun 18, 1984 | 11.57 |
| Dec 21, 2013 | 11.54 |
| Jan 23, 1957 | 11.53 |
| Jan 12, 2018 | 11.23 |
| Feb 26, 1961 | 10.92 |
| Mar 30, 1960 | 10.75 |
| Jan 12, 2017 | 10.7 |
| Oct 2, 1945 | 10.63 |
| Mar 5, 1964 | 10.56 |
Data provided by the National Weather Service.