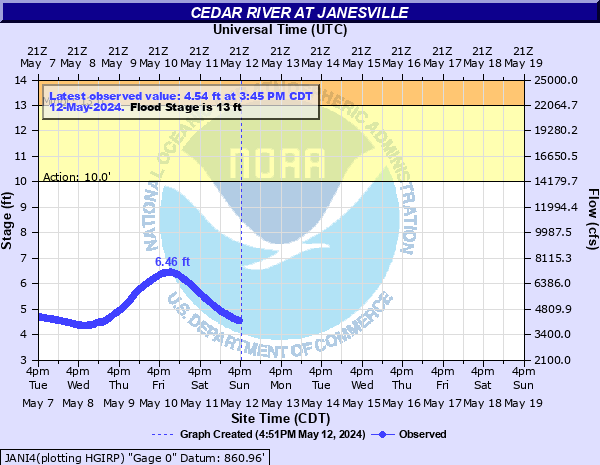
Cedar River at Janesville
Critical Stages
10' - Action
13' - Flood
15' - Moderate
18' - Major
Latest Observation
Updated: 7:45 AM CST 12/10/25
Status: No Flooding
Stage: 1.54 ft
Flow: 0.6 kcfs
Forecast
Forecast not available for this location.
| Time | Stage (ft) | Flow (kcfs) |
|---|---|---|
| 7:45 AM 12/10 | 1.54 | 0.6 |
| 7:30 AM 12/10 | 1.54 | 0.6 |
| 7:15 AM 12/10 | 1.54 | 0.6 |
| 7:00 AM 12/10 | 1.53 | 0.592 |
| 6:45 AM 12/10 | 1.52 | 0.585 |
| 6:30 AM 12/10 | 1.54 | 0.6 |
| 6:15 AM 12/10 | 1.53 | 0.592 |
| 6:00 AM 12/10 | 1.53 | 0.592 |
| 5:45 AM 12/10 | 1.54 | 0.6 |
| 5:30 AM 12/10 | 1.55 | 0.607 |
| 5:15 AM 12/10 | 1.53 | 0.592 |
| 5:00 AM 12/10 | 1.55 | 0.607 |
| 4:45 AM 12/10 | 1.55 | 0.607 |
| 4:30 AM 12/10 | 1.55 | 0.607 |
| 4:15 AM 12/10 | 1.54 | 0.6 |
| 4:00 AM 12/10 | 1.54 | 0.6 |
| 3:45 AM 12/10 | 1.54 | 0.6 |
| 3:30 AM 12/10 | 1.54 | 0.6 |
| 3:15 AM 12/10 | 1.55 | 0.607 |
| 3:00 AM 12/10 | 1.54 | 0.6 |
| 2:45 AM 12/10 | 1.55 | 0.607 |
| 2:30 AM 12/10 | 1.54 | 0.6 |
| 2:15 AM 12/10 | 1.56 | 0.615 |
| 2:00 AM 12/10 | 1.54 | 0.6 |
| 1:45 AM 12/10 | 1.55 | 0.607 |
| 1:30 AM 12/10 | 1.56 | 0.615 |
| 1:15 AM 12/10 | 1.56 | 0.615 |
| 1:00 AM 12/10 | 1.55 | 0.607 |
| 12:45 AM 12/10 | 1.55 | 0.607 |
| 12:30 AM 12/10 | 1.56 | 0.615 |
14' -
Water threatens areas of Janesville south of 8th St.
13' -
Water affects W 3rd St and may result in evacuation of a trailer court in Janesville. Water also affects much of the Janesville city park as well as nearby gravel roads.
12' -
Widespread lowland flooding occurs especially within the city park. The flooding covers approximately 6000 acres.
11' -
Lowland flooding of the city park occurs.
| Date | Stage (ft) |
|---|---|
| Jun 10, 2008 | 19.45 |
| Jul 22, 1999 | 17.15 |
| Mar 3, 1965 | 16.33 |
| Mar 28, 1961 | 16.33 |
| Sep 24, 2016 | 16.27 |
| Mar 17, 1945 | 16.2 |
| Apr 1, 1933 | 16 |
| Mar 16, 1929 | 16 |
| Aug 18, 1993 | 15.74 |
| Aug 30, 2021 | 15.11 |
| May 22, 2013 | 14.62 |
| Jun 25, 2024 | 14.36 |
| Apr 7, 1965 | 14.33 |
| Mar 1, 1948 | 14.1 |
| Apr 9, 1951 | 14.05 |
| Mar 31, 1962 | 13.86 |
| Jul 1, 1969 | 13.74 |
| Sep 18, 2004 | 13.4 |
| Apr 14, 2001 | 13.3 |
| Jul 17, 1968 | 12.79 |
Data provided by the National Weather Service.