Waupaca River near Waupaca
Critical Stages
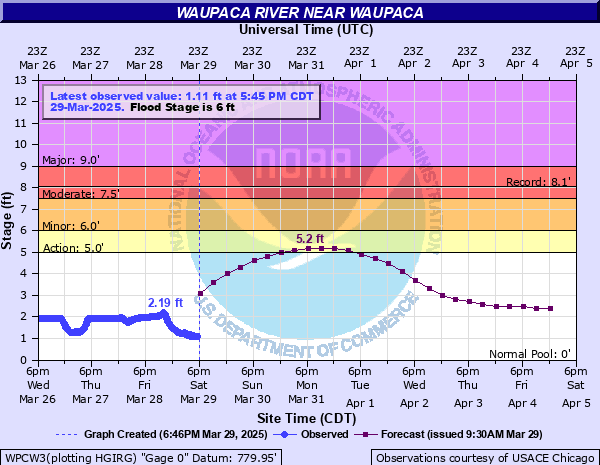
5' - Action
6' - Flood
7.5' - Moderate
9' - Major
Latest Observation
Updated: 2:45 PM CST 12/15/25
Status: No Flooding
Stage: 3.17 ft
Flow: 0.663 kcfs
Forecast
Forecast not available for this location.
| Time | Stage (ft) | Flow (kcfs) |
|---|---|---|
| 2:45 PM 12/15 | 3.17 | 0.663 |
| 2:30 PM 12/15 | 3.17 | 0.663 |
| 2:15 PM 12/15 | 3.16 | 0.661 |
| 2:00 PM 12/15 | 3.16 | 0.661 |
| 1:45 PM 12/15 | 3.16 | 0.661 |
| 1:30 PM 12/15 | 3.16 | 0.661 |
| 1:15 PM 12/15 | 3.15 | 0.659 |
| 1:00 PM 12/15 | 3.15 | 0.659 |
| 12:45 PM 12/15 | 3.14 | 0.657 |
| 12:30 PM 12/15 | 3.14 | 0.657 |
| 12:15 PM 12/15 | 3.13 | 0.655 |
| 12:00 PM 12/15 | 3.12 | 0.653 |
| 11:45 AM 12/15 | 3.11 | 0.651 |
| 11:30 AM 12/15 | 3.1 | 0.649 |
| 11:15 AM 12/15 | 3.1 | 0.649 |
| 11:00 AM 12/15 | 3.08 | 0.645 |
| 10:45 AM 12/15 | 3.08 | 0.645 |
| 10:30 AM 12/15 | 3.07 | 0.643 |
| 10:15 AM 12/15 | 3.06 | 0.641 |
| 10:00 AM 12/15 | 3.06 | 0.641 |
| 9:45 AM 12/15 | 3.05 | 0.639 |
| 9:30 AM 12/15 | 3.04 | 0.637 |
| 9:15 AM 12/15 | 3.04 | 0.637 |
| 9:00 AM 12/15 | 3.04 | 0.637 |
| 8:45 AM 12/15 | 3.03 | 0.635 |
| 8:30 AM 12/15 | 3.03 | 0.635 |
| 8:15 AM 12/15 | 3.02 | 0.633 |
| 8:00 AM 12/15 | 3.02 | 0.633 |
| 7:45 AM 12/15 | 3.02 | 0.633 |
| 7:30 AM 12/15 | 3.02 | 0.633 |
11' -
Floodwaters are covering Harrington and Reek Roads.
9' -
Flood waters are near the surface of Harrington Road and there is widespread lowland flooding in the Waupaca area.
7.5' -
Water touches the lowest portion of the Harrington Road bridge and there is widespread lowland flooding in the Waupaca area.
6' -
There is widespread lowland flooding in the Waupaca area.
5' -
There is minor lowland flooding.
| Date | Stage (ft) |
|---|---|
| Mar 28, 1950 | 8.06 |
| Mar 20, 1948 | 6.9 |
| Mar 19, 1918 | 6.2 |
| Mar 16, 2019 | 6.17 |
| Feb 11, 1966 | 6.15 |
| Mar 16, 1929 | 6.1 |
| Apr 4, 1934 | 5.9 |
| Mar 17, 1919 | 5.7 |
| Jun 24, 1940 | 5.69 |
| Apr 13, 1923 | 5.5 |
| Jun 23, 2002 | 5.3 |
| Dec 3, 1991 | 5.16 |
| Apr 11, 2011 | 3.87 |
| Mar 17, 2016 | 3.85 |
| Apr 2, 2023 | 3.79 |
Data provided by the National Weather Service.