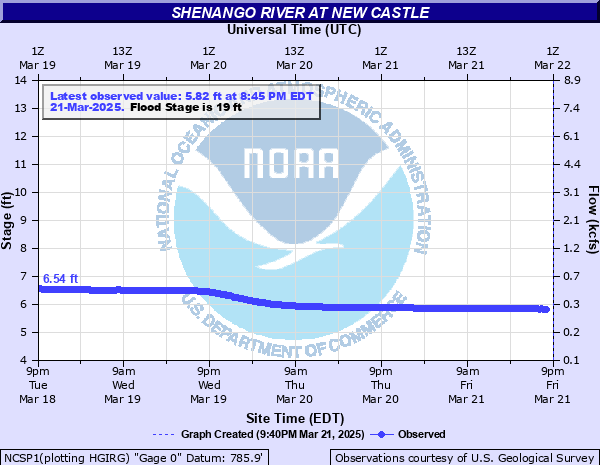
Shenango River at New Castle
Critical Stages
15.9' - Action
19' - Flood
21' - Moderate
23' - Major
Latest Observation
Updated: 1:45 AM EST 12/16/25
Status: No Flooding
Stage: 6.82 ft
Flow: 0.613 kcfs
Forecast
Forecast not available for this location.
| Time | Stage (ft) | Flow (kcfs) |
|---|---|---|
| 1:45 AM 12/16 | 6.82 | 0.613 |
| 1:30 AM 12/16 | 6.8 | 0.604 |
| 1:15 AM 12/16 | 6.79 | 0.599 |
| 1:00 AM 12/16 | 6.77 | 0.591 |
| 12:45 AM 12/16 | 6.75 | 0.582 |
| 12:30 AM 12/16 | 6.73 | 0.573 |
| 12:15 AM 12/16 | 6.71 | 0.564 |
| 12:00 AM 12/16 | 6.69 | 0.556 |
| 11:45 PM 12/15 | 6.67 | 0.547 |
| 11:30 PM 12/15 | 6.65 | 0.539 |
| 11:15 PM 12/15 | 6.64 | 0.535 |
| 11:00 PM 12/15 | 6.62 | 0.527 |
| 10:45 PM 12/15 | 6.6 | 0.519 |
| 10:30 PM 12/15 | 6.58 | 0.511 |
| 10:15 PM 12/15 | 6.57 | 0.507 |
| 10:00 PM 12/15 | 6.55 | 0.499 |
| 9:45 PM 12/15 | 6.54 | 0.495 |
| 9:30 PM 12/15 | 6.52 | 0.488 |
| 9:15 PM 12/15 | 6.51 | 0.484 |
| 9:00 PM 12/15 | 6.5 | 0.48 |
| 8:45 PM 12/15 | 6.49 | 0.475 |
| 8:30 PM 12/15 | 6.49 | 0.475 |
| 8:15 PM 12/15 | 6.48 | 0.47 |
| 8:00 PM 12/15 | 6.48 | 0.47 |
| 7:45 PM 12/15 | 6.47 | 0.465 |
| 7:30 PM 12/15 | 6.47 | 0.465 |
| 7:15 PM 12/15 | 6.47 | 0.465 |
| 7:00 PM 12/15 | 6.47 | 0.465 |
| 6:45 PM 12/15 | 6.47 | 0.465 |
| 6:30 PM 12/15 | 6.47 | 0.465 |
24' -
Flood of Record from March 1913. Stage is estimated based on flow from original gage site.
22.7' -
Flood waters reach railroad tracks on right downstream bank across the river from the water company.
20.6' -
Hundreds of homes and businesses flooded in New Castle.
19.5' -
Water company out of operation unless sandbags have been installed.
18.6' -
Water reaches the floor level at Water Company Pumping Station.
18.25' -
Water reaches the gage house tabletop. Gage out of service.
18' -
Basements are flooded in low lying areas of New Castle.
| Date | Stage (ft) |
|---|---|
| Jan 22, 1959 | 20.6 |
| Oct 17, 1954 | 17.6 |
| Jul 17, 1958 | 17.5 |
| Jan 28, 1952 | 17 |
| May 28, 1946 | 17 |
| Feb 11, 1959 | 16.8 |
| Dec 31, 1942 | 16.7 |
| Mar 11, 1964 | 16 |
| Mar 7, 1964 | 15.8 |
| Apr 1, 1960 | 15 |
Data provided by the National Weather Service.