« Back to Amherst Junction Rivers
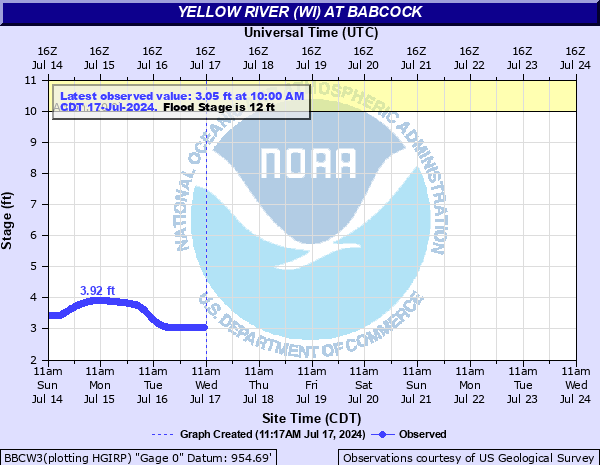
Yellow River (WI) at Babcock
Critical Stages
10' - Action
12' - Flood
15.5' - Moderate
17' - Major
Latest Observation
Updated: 2:00 PM CST 12/15/25
Status: No Flooding
Stage: 2.27 ft
Flow: 0.0364 kcfs
Forecast
Forecast not available for this location.
| Time | Stage (ft) | Flow (kcfs) |
|---|---|---|
| 2:00 PM 12/15 | 2.27 | 0.0364 |
| 1:45 PM 12/15 | 2.27 | 0.0364 |
| 1:30 PM 12/15 | 2.27 | 0.0364 |
| 1:15 PM 12/15 | 2.26 | 0.0356 |
| 1:00 PM 12/15 | 2.26 | 0.0356 |
| 12:45 PM 12/15 | 2.26 | 0.0356 |
| 12:30 PM 12/15 | 2.26 | 0.0356 |
| 12:15 PM 12/15 | 2.26 | 0.0356 |
| 12:00 PM 12/15 | 2.26 | 0.0356 |
| 11:45 AM 12/15 | 2.26 | 0.0356 |
| 11:30 AM 12/15 | 2.26 | 0.0356 |
| 11:15 AM 12/15 | 2.26 | 0.0356 |
| 11:00 AM 12/15 | 2.26 | 0.0356 |
| 10:45 AM 12/15 | 2.26 | 0.0356 |
| 10:30 AM 12/15 | 2.26 | 0.0356 |
| 10:15 AM 12/15 | 2.26 | 0.0356 |
| 10:00 AM 12/15 | 2.26 | 0.0356 |
| 9:45 AM 12/15 | 2.25 | 0.0348 |
| 9:30 AM 12/15 | 2.25 | 0.0348 |
| 9:15 AM 12/15 | 2.26 | 0.0356 |
| 9:00 AM 12/15 | 2.25 | 0.0348 |
| 8:45 AM 12/15 | 2.25 | 0.0348 |
| 8:30 AM 12/15 | 2.25 | 0.0348 |
| 8:15 AM 12/15 | 2.25 | 0.0348 |
| 8:00 AM 12/15 | 2.25 | 0.0348 |
| 7:45 AM 12/15 | 2.25 | 0.0348 |
| 7:30 AM 12/15 | 2.25 | 0.0348 |
| 7:15 AM 12/15 | 2.25 | 0.0348 |
| 7:00 AM 12/15 | 2.24 | 0.034 |
| 6:45 AM 12/15 | 2.24 | 0.034 |
18.43' -
Highway 80 is closed near Babcock. About a foot of water is covering the Highway 80 bridge over the river and most of the town of Babcock. Up to 6 inches of water covers a portion of the Ocean Spray Company.
17' -
Highway 80 is closed near the town of Babcock. Widespread wooded land along the river is flooded.
15.6' -
Floodwaters are near a couple of homes in the Babcock area near Highway 173.
14' -
Widespread flooding is occurring in wooded lowland and agricultural areas.
12' -
Flooding is confined mainly to agricultural and wooded lowland and marshes.
10' -
There is minor flooding to lowland and agricultural land.
2' -
Submerged rocks and structures may become more hazardous to boaters over more sections of the river.
| Date | Stage (ft) |
|---|---|
| Sep 24, 2010 | 18.43 |
| Apr 2, 1952 | 17.38 |
| Mar 31, 1967 | 17.05 |
| Mar 27, 1963 | 16.03 |
| Apr 18, 2019 | 15.95 |
| Aug 29, 2021 | 15.92 |
| Apr 5, 1956 | 15.85 |
| Mar 18, 1945 | 15.78 |
| Sep 22, 1986 | 15.77 |
| Feb 22, 2017 | 15.64 |
| Jun 19, 1993 | 15.63 |
| Mar 17, 2016 | 15.53 |
| May 17, 1968 | 15.53 |
| Apr 17, 1973 | 15.46 |
| Mar 28, 1961 | 15.41 |
| Mar 24, 1979 | 15.41 |
| Mar 7, 1983 | 15.4 |
| Jun 23, 2024 | 15.26 |
| Mar 22, 1953 | 15.06 |
| Sep 22, 1980 | 14.91 |
Data provided by the National Weather Service.