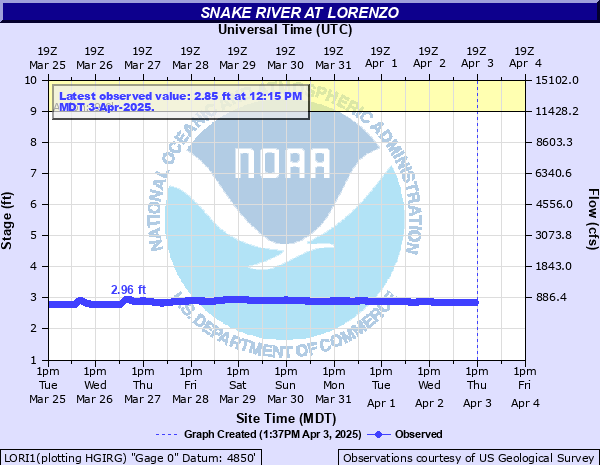
Snake River at Lorenzo
Critical Stages
9' - Action
Flood
Moderate
Major
Latest Observation
Updated: 1:15 PM MST 12/15/25
Status: No Flooding
Stage: 3.09 ft
Flow: 0.96 kcfs
Forecast
Forecast not available for this location.
| Time | Stage (ft) | Flow (kcfs) |
|---|---|---|
| 1:15 PM 12/15 | 3.09 | 0.96 |
| 1:00 PM 12/15 | 3.09 | 0.96 |
| 12:45 PM 12/15 | 3.09 | 0.96 |
| 12:30 PM 12/15 | 3.09 | 0.96 |
| 12:15 PM 12/15 | 3.09 | 0.96 |
| 12:00 PM 12/15 | 3.09 | 0.96 |
| 11:45 AM 12/15 | 3.09 | 0.96 |
| 11:30 AM 12/15 | 3.09 | 0.96 |
| 11:15 AM 12/15 | 3.09 | 0.96 |
| 11:00 AM 12/15 | 3.09 | 0.96 |
| 10:45 AM 12/15 | 3.09 | 0.96 |
| 10:30 AM 12/15 | 3.09 | 0.96 |
| 10:15 AM 12/15 | 3.09 | 0.96 |
| 10:00 AM 12/15 | 3.09 | 0.96 |
| 9:45 AM 12/15 | 3.09 | 0.96 |
| 9:30 AM 12/15 | 3.09 | 0.96 |
| 9:15 AM 12/15 | 3.09 | 0.96 |
| 9:00 AM 12/15 | 3.09 | 0.96 |
| 8:45 AM 12/15 | 3.09 | 0.96 |
| 8:30 AM 12/15 | 3.09 | 0.96 |
| 8:15 AM 12/15 | 3.09 | 0.96 |
| 8:00 AM 12/15 | 3.09 | 0.96 |
| 7:45 AM 12/15 | 3.09 | 0.96 |
| 7:30 AM 12/15 | 3.09 | 0.96 |
| 7:15 AM 12/15 | 3.09 | 0.96 |
| 7:00 AM 12/15 | 3.09 | 0.96 |
| 6:45 AM 12/15 | 3.09 | 0.96 |
| 6:30 AM 12/15 | 3.09 | 0.96 |
| 6:15 AM 12/15 | 3.09 | 0.96 |
| 6:00 AM 12/15 | 3.09 | 0.96 |
10.7' -
Fields and low-lying areas near the river between US HWY 20 bridge near Lorenzo downstream to the confluence of the Snake River and Henrys Fork may experience seep and ponding. The Lorenzo boat launch may be closed due to high flows.
9' -
Actual flooding is limited to islands and bars between US HWY 20 bridge near Lorenzo downstream to the confluence of the Snake River and Henrys Fork. Channel changes, including flows between 11,000 to 15,000 CFS into high water channels, may impinge upon levees in the reach and threaten their structural integrity, leading to a breach and possible flooding outside of the levee system. Actions by local agencies may include responding to potential breaches and conducting emergency repairs.
| Date | Stage (ft) |
|---|---|
| Jun 22, 1997 | 13.79 |
| Jun 26, 1986 | 11.75 |
| Jun 10, 1981 | 11.46 |
| Jun 16, 1984 | 11.42 |
| Jun 14, 2017 | 11.3 |
| Jun 17, 1991 | 11.11 |
| Jun 10, 1980 | 10.98 |
| Jul 18, 1982 | 10.96 |
| Jun 23, 2009 | 10.96 |
| Jun 10, 1985 | 10.9 |
| Jun 19, 2018 | 10.9 |
| Jun 2, 2011 | 10.81 |
| Apr 19, 2019 | 10.8 |
| Jun 5, 1998 | 10.61 |
| May 1, 2006 | 10.6 |
| Jun 2, 2008 | 10.49 |
| Jun 13, 2010 | 10.31 |
| Jun 30, 2020 | 9.8 |
| May 26, 2007 | 9.75 |
| Jun 9, 2014 | 9.38 |
Data provided by the National Weather Service.