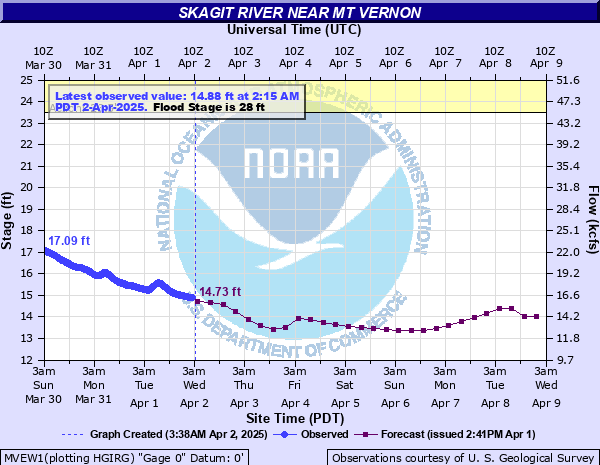
Skagit River near Mt Vernon
Critical Stages
23.5' - Action
28' - Flood
30' - Moderate
32' - Major
Latest Observation
Updated: 4:15 PM PST 12/5/25
Status: No Flooding
Stage: 14.2 ft
Flow: 14.3 kcfs
Forecast
| Time | Stage (ft) | Flow (kcfs) |
|---|---|---|
| 10 PM 12/5 | 14.36 | 14.7 |
| 4 AM 12/6 | 15.18 | 16.8 |
| 10 AM 12/6 | 16.21 | 19.7 |
| 4 PM 12/6 | 17.42 | 23.3 |
| 10 PM 12/6 | 19.32 | 29.4 |
| 4 AM 12/7 | 21.07 | 35.7 |
| 10 AM 12/7 | 21.83 | 38.5 |
| 4 PM 12/7 | 21.86 | 38.7 |
| 10 PM 12/7 | 21.37 | 36.8 |
| 4 AM 12/8 | 20.78 | 34.6 |
| 10 AM 12/8 | 20.51 | 33.6 |
| 4 PM 12/8 | 20.94 | 35.2 |
| 10 PM 12/8 | 21.94 | 39 |
| 4 AM 12/9 | 23.37 | 44.7 |
| 10 AM 12/9 | 25.67 | 54.6 |
| 4 PM 12/9 | 28.69 | 68.8 |
| 10 PM 12/9 | 30.55 | 79.1 |
| 4 AM 12/10 | 31.52 | 85.5 |
| 10 AM 12/10 | 31.56 | 85.8 |
| 4 PM 12/10 | 30.53 | 78.9 |
| 10 PM 12/10 | 30.21 | 76.8 |
| 4 AM 12/11 | 30.65 | 79.7 |
| 10 AM 12/11 | 31.29 | 84 |
| 4 PM 12/11 | 31.61 | 86.1 |
| 10 PM 12/11 | 31.6 | 86.1 |
| 4 AM 12/12 | 31.15 | 83 |
| 10 AM 12/12 | 29.96 | 75.3 |
| 4 PM 12/12 | 28.3 | 66.9 |
| 10 PM 12/12 | 27.33 | 62.2 |
| 4 AM 12/13 | 27.13 | 61.3 |
| 10 AM 12/13 | 27.36 | 62.4 |
| 4 PM 12/13 | 28.02 | 65.5 |
| 10 PM 12/13 | 28.43 | 67.6 |
| 4 AM 12/14 | 27.85 | 64.7 |
| 10 AM 12/14 | 26.46 | 58.2 |
| 4 PM 12/14 | 25.02 | 51.7 |
| 10 PM 12/14 | 23.91 | 46.9 |
| 4 AM 12/15 | 23.13 | 43.7 |
| Time | Stage (ft) | Flow (kcfs) |
|---|---|---|
| 4:15 PM 12/5 | 14.2 | 14.3 |
| 4:00 PM 12/5 | 14.18 | 14.3 |
| 3:45 PM 12/5 | 14.18 | 14.3 |
| 3:30 PM 12/5 | 14.17 | 14.3 |
| 3:15 PM 12/5 | 14.17 | 14.3 |
| 3:00 PM 12/5 | 14.17 | 14.3 |
| 2:45 PM 12/5 | 14.16 | 14.2 |
| 2:30 PM 12/5 | 14.15 | 14.2 |
| 2:15 PM 12/5 | 14.15 | 14.2 |
| 2:00 PM 12/5 | 14.16 | 14.2 |
| 1:45 PM 12/5 | 14.15 | 14.2 |
| 1:30 PM 12/5 | 14.15 | 14.2 |
| 1:15 PM 12/5 | 14.16 | 14.2 |
| 1:00 PM 12/5 | 14.16 | 14.2 |
| 12:45 PM 12/5 | 14.17 | 14.3 |
| 12:30 PM 12/5 | 14.16 | 14.2 |
| 12:15 PM 12/5 | 14.16 | 14.2 |
| 12:00 PM 12/5 | 14.17 | 14.3 |
| 11:45 AM 12/5 | 14.16 | 14.2 |
| 11:30 AM 12/5 | 14.17 | 14.3 |
| 11:15 AM 12/5 | 14.17 | 14.3 |
| 11:00 AM 12/5 | 14.17 | 14.3 |
| 10:45 AM 12/5 | 14.17 | 14.3 |
| 10:30 AM 12/5 | 14.16 | 14.2 |
| 10:15 AM 12/5 | 14.17 | 14.3 |
| 10:00 AM 12/5 | 14.17 | 14.3 |
| 9:45 AM 12/5 | 14.17 | 14.3 |
| 9:30 AM 12/5 | 14.16 | 14.2 |
| 9:15 AM 12/5 | 14.16 | 14.2 |
| 9:00 AM 12/5 | 14.16 | 14.2 |
36' -
the Skagit River will cause severe near record flooding from Sedro Woolley downstream through Mount Vernon to the mouth. Deep and swift flood waters will inundate and possibly damage many roads...farmlands and residential areas. Levees may be damaged. Flood areas will also include headwaters...tributaries...and other streams in the Skagit basin. This level for this location corresponds to a Phase 1 flood in the Skagit County flood system.
32' -
the Skagit River will cause major flooding from Sedro Woolley downstream through Mount Vernon to the mouth. Deep and swift flood waters will inundate many roads...farmlands and residential areas. Flooding will occur all along the river including headwaters...tributaries...and other streams within and near the Skagit River Basin. This level for this location on the Skagit corresponds to a Phase 2 flood in the Skagit County flood system.
30' -
the Skagit River will flood from Sedro Woolley downstream through Mount Vernon to the mouth. Flood waters will inundate some low-lying roads...farmlands and residential areas. This level for this location on the Skagit corresponds to a phase 3 flood in the Skagit County flood system.
28' -
the Skagit River will cause minor flooding from Sedro Woolley downstream through Mount Vernon to the mouth...with shallow flooding in low pasture lands and over a few low-lying roads near the river. This level for this location on the Skagit corresponds to a Phase 3 flood in the Skagit County flood system.
| Date | Stage (ft) |
|---|---|
| Nov 25, 1990 | 37.37 |
| Nov 30, 1995 | 37.34 |
| Nov 16, 2021 | 37.32 |
| Nov 11, 1906 | 37 |
| Feb 11, 1951 | 36.85 |
| Nov 11, 1990 | 36.61 |
| Oct 21, 2003 | 36.19 |
| Dec 4, 1975 | 35.66 |
| Nov 4, 1955 | 34.49 |
| Nov 28, 1949 | 34.21 |
| Dec 27, 1980 | 34.16 |
| Dec 19, 1979 | 33.99 |
| Nov 7, 2006 | 33.85 |
| Nov 24, 2017 | 33.15 |
| Dec 5, 1989 | 32.39 |
| Apr 30, 1959 | 31.68 |
| Nov 9, 1995 | 31.64 |
| Nov 24, 1959 | 31.58 |
| Nov 29, 2014 | 31.5 |
| Nov 11, 1989 | 31.19 |
Data provided by the National Weather Service.