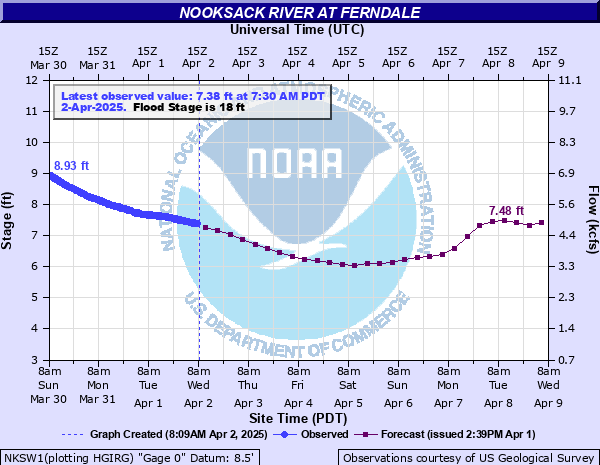
Nooksack River at Ferndale
Critical Stages
15' - Action
18' - Flood
20.5' - Moderate
23' - Major
Latest Observation
Updated: 3:30 PM PST 12/5/25
Status: No Flooding
Stage: 5.96 ft
Flow: 2.89 kcfs
Forecast
| Time | Stage (ft) | Flow (kcfs) |
|---|---|---|
| 10 PM 12/5 | 6.24 | 3.19 |
| 4 AM 12/6 | 7.43 | 4.53 |
| 10 AM 12/6 | 9.81 | 7.63 |
| 4 PM 12/6 | 11.94 | 10.8 |
| 10 PM 12/6 | 12.34 | 11.4 |
| 4 AM 12/7 | 11.91 | 10.8 |
| 10 AM 12/7 | 11.11 | 9.53 |
| 4 PM 12/7 | 10.36 | 8.41 |
| 10 PM 12/7 | 10.07 | 7.99 |
| 4 AM 12/8 | 10.15 | 8.11 |
| 10 AM 12/8 | 10.2 | 8.18 |
| 4 PM 12/8 | 10.27 | 8.28 |
| 10 PM 12/8 | 11.68 | 10.4 |
| 4 AM 12/9 | 13.67 | 13.6 |
| 10 AM 12/9 | 14.98 | 15.9 |
| 4 PM 12/9 | 15.51 | 16.9 |
| 10 PM 12/9 | 15.46 | 16.8 |
| 4 AM 12/10 | 15.22 | 16.4 |
| 10 AM 12/10 | 15.46 | 16.8 |
| 4 PM 12/10 | 16.34 | 18.5 |
| 10 PM 12/10 | 17.26 | 20.6 |
| 4 AM 12/11 | 18 | 22.3 |
| 10 AM 12/11 | 18.35 | 23.2 |
| 4 PM 12/11 | 18.29 | 23.1 |
| 10 PM 12/11 | 17.87 | 22 |
| 4 AM 12/12 | 17.28 | 20.6 |
| 10 AM 12/12 | 16.68 | 19.2 |
| 4 PM 12/12 | 16.2 | 18.2 |
| 10 PM 12/12 | 15.89 | 17.6 |
| 4 AM 12/13 | 15.88 | 17.6 |
| 10 AM 12/13 | 15.92 | 17.6 |
| 4 PM 12/13 | 15.79 | 17.4 |
| 10 PM 12/13 | 15.43 | 16.7 |
| 4 AM 12/14 | 14.85 | 15.7 |
| 10 AM 12/14 | 14.1 | 14.4 |
| 4 PM 12/14 | 13.26 | 13 |
| 10 PM 12/14 | 12.52 | 11.7 |
| 4 AM 12/15 | 12.05 | 11 |
| Time | Stage (ft) | Flow (kcfs) |
|---|---|---|
| 4:30 PM 12/5 | 5.96 | 2.89 |
| 4:15 PM 12/5 | 5.96 | 2.89 |
| 4:00 PM 12/5 | 5.97 | 2.9 |
| 3:45 PM 12/5 | 5.97 | 2.9 |
| 3:30 PM 12/5 | 5.96 | 2.89 |
| 3:15 PM 12/5 | 5.96 | 2.89 |
| 3:00 PM 12/5 | 5.96 | 2.89 |
| 2:45 PM 12/5 | 5.95 | 2.88 |
| 2:30 PM 12/5 | 5.96 | 2.89 |
| 2:15 PM 12/5 | 5.95 | 2.88 |
| 2:00 PM 12/5 | 5.95 | 2.88 |
| 1:45 PM 12/5 | 5.94 | 2.87 |
| 1:30 PM 12/5 | 5.94 | 2.87 |
| 1:15 PM 12/5 | 5.94 | 2.87 |
| 1:00 PM 12/5 | 5.95 | 2.88 |
| 12:45 PM 12/5 | 5.94 | 2.87 |
| 12:30 PM 12/5 | 5.94 | 2.87 |
| 12:15 PM 12/5 | 5.94 | 2.87 |
| 12:00 PM 12/5 | 5.95 | 2.88 |
| 11:45 AM 12/5 | 5.94 | 2.87 |
| 11:30 AM 12/5 | 5.95 | 2.88 |
| 11:15 AM 12/5 | 5.95 | 2.88 |
| 11:00 AM 12/5 | 5.94 | 2.87 |
| 10:45 AM 12/5 | 5.93 | 2.86 |
| 10:30 AM 12/5 | 5.94 | 2.87 |
| 10:15 AM 12/5 | 5.94 | 2.87 |
| 10:00 AM 12/5 | 5.94 | 2.87 |
| 9:45 AM 12/5 | 5.93 | 2.86 |
| 9:30 AM 12/5 | 5.94 | 2.87 |
| 9:15 AM 12/5 | 5.94 | 2.87 |
23' -
the Nooksack River will cause major near record flooding from near Ferndale downstream to the mouth, overtopping levees on both sides of the river and flooding roadways on the Lummi Peninsula including Hexton Way. Deep and swift flood waters will inundate residential areas...farm lands...and roads. In addition...flood waters could overflow and flood the Sumas drainage. Flooding will occur all along the river including headwaters...tributaries...and other streams within and near the Nooksack River Basin.
22' -
the Nooksack River will overflow levees and banks along the east bank of the river from Hovander Park downstream to Marietta, causing widespread flooding from near Ferndale downstream to the mouth...with swift waters in residential areas and over farmlands and roads. Erosion may damage some river banks. Flooding within the City of Ferndale affects Main Street in the vicinity of the Whatcom Transportation Authority Station.
20.5' -
the Nooksack River will overflow levees and banks along the east bank of the river from Hovander Park downstream to Marietta, causing widespread flooding from near Ferndale downstream to the mouth...with swift waters in residential areas and over farm lands and roads. Erosion may damage some river banks.
20' -
the river will flood additional areas within the City of Ferndale including low-lying residential areas and roads including Washington Street, Portal Way and Second Avenue.
18' -
the river begins overtopping its banks within the City of Ferndale flooding low-lying areas within the City and low pasture lands along the river from near Ferndale downstream to the mouth.
17' -
the Nooksack River will overtop levees along Bertrand Creek and near Marine Drive, causing shallow flooding of low pasture lands along the river and additional roadways within the floodplain including Slater Road.
16' -
the river begins spilling over its banks into low pasture lands flooding some roadways that are not protected by levees including Marine Drive and Ferndale Road.
| Date | Stage (ft) |
|---|---|
| Feb 10, 1951 | 31.23 |
| Dec 30, 1917 | 30.6 |
| Feb 27, 1932 | 30.4 |
| Jan 25, 1935 | 30.2 |
| Oct 26, 1945 | 28.6 |
| Dec 12, 1921 | 28.15 |
| Nov 4, 1955 | 27.23 |
| Jan 16, 1961 | 26.38 |
| Apr 30, 1959 | 26.21 |
| Nov 27, 1949 | 25.55 |
| Nov 20, 1962 | 25.15 |
| Nov 27, 1963 | 24.37 |
| Dec 10, 1956 | 24.24 |
| Nov 23, 1959 | 23.84 |
| Nov 16, 2021 | 23.81 |
| Nov 10, 1990 | 23.56 |
| Nov 19, 1954 | 23.3 |
| Jan 31, 1965 | 22.98 |
| Jan 8, 2009 | 22.76 |
| Feb 1, 1953 | 22.61 |
Data provided by the National Weather Service.