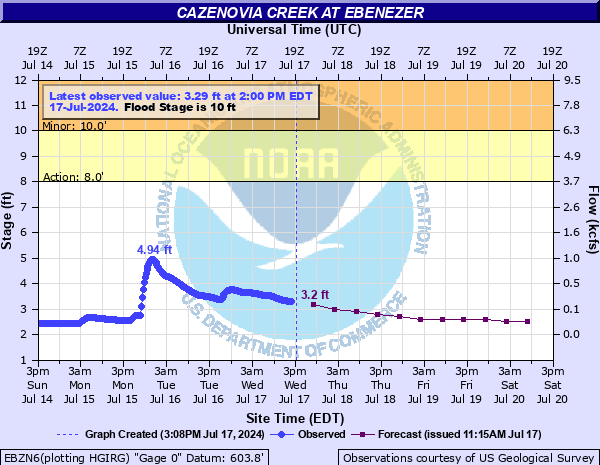
Cazenovia Creek at Ebenezer
Critical Stages
8' - Action
10' - Flood
12' - Moderate
14' - Major
Latest Observation
Updated: 4:00 AM EST 12/15/25
Status: No Flooding
Stage: 4.83 ft
Flow: 0.912 kcfs
Forecast
| Time | Stage (ft) | Flow (kcfs) |
|---|---|---|
| 7 AM 12/15 | 2.6 | 0.064 |
| 1 PM 12/15 | 2.6 | 0.064 |
| 7 PM 12/15 | 2.6 | 0.064 |
| 1 AM 12/16 | 2.6 | 0.064 |
| 7 AM 12/16 | 2.6 | 0.064 |
| 1 PM 12/16 | 2.6 | 0.064 |
| 7 PM 12/16 | 2.6 | 0.064 |
| 1 AM 12/17 | 2.6 | 0.064 |
| 7 AM 12/17 | 2.6 | 0.064 |
| Time | Stage (ft) | Flow (kcfs) |
|---|---|---|
| 4:00 AM 12/15 | 4.83 | 0.912 |
| 3:45 AM 12/15 | 4.84 | 0.917 |
| 3:30 AM 12/15 | 4.84 | 0.917 |
| 3:15 AM 12/15 | 4.86 | 0.928 |
| 3:00 AM 12/15 | 4.87 | 0.934 |
| 2:45 AM 12/15 | 4.88 | 0.94 |
| 2:30 AM 12/15 | 4.9 | 0.951 |
| 2:15 AM 12/15 | 4.91 | 0.956 |
| 2:00 AM 12/15 | 4.93 | 0.968 |
| 1:45 AM 12/15 | 4.94 | 0.973 |
| 1:30 AM 12/15 | 4.95 | 0.979 |
| 1:15 AM 12/15 | 4.94 | 0.973 |
| 1:00 AM 12/15 | 4.94 | 0.973 |
| 12:45 AM 12/15 | 4.94 | 0.973 |
| 12:30 AM 12/15 | 4.94 | 0.973 |
| 12:15 AM 12/15 | 4.96 | 0.985 |
| 12:00 AM 12/15 | 4.97 | 0.991 |
| 11:45 PM 12/14 | 4.97 | 0.991 |
| 11:30 PM 12/14 | 4.96 | 0.985 |
| 11:15 PM 12/14 | 4.96 | 0.985 |
| 11:00 PM 12/14 | 4.97 | 0.991 |
| 10:45 PM 12/14 | 4.99 | 1 |
| 10:30 PM 12/14 | 5.01 | 1.01 |
| 10:15 PM 12/14 | 5.02 | 1.02 |
| 10:00 PM 12/14 | 5.02 | 1.02 |
| 9:45 PM 12/14 | 5.02 | 1.02 |
| 9:30 PM 12/14 | 5.03 | 1.03 |
| 9:15 PM 12/14 | 5.05 | 1.04 |
| 9:00 PM 12/14 | 5.06 | 1.04 |
| 8:45 PM 12/14 | 5.08 | 1.05 |
14' -
Major flood, widespread flooding in Cazenovia Park, Southgate Plaza, Mill Road and Seneca Streets in West Seneca, Parkside Drive, Willowdale Road, and Orchard Park Rd. May impact homes and commercial properties. Level near top of controls in South Buffalo downstream from Cazenovia Park. Localized flooding upstream in East Aurora.
12' -
Moderate flood, localized flooding possible in vicinity of Southgate Plaza in West Seneca; considerable flooding in the Cazenovia Park area of South Buffalo and West Seneca.
10' -
Flood stage, minor flooding can be expected in low lying areas east of Orchard Park Road and south of Ridge Road in West Seneca. Some inundation of Cazenovia Park in South Buffalo.
8' -
Action stage, high flows. No flooding.
| Date | Stage (ft) |
|---|---|
| Mar 1, 1955 | 15.82 |
| Mar 17, 1942 | 15.11 |
| Sep 9, 2004 | 14.85 |
| Mar 7, 1956 | 14.65 |
| Aug 10, 2009 | 14.15 |
| Jan 22, 1957 | 14.09 |
| Mar 21, 1978 | 14.05 |
| Oct 2, 1945 | 14.02 |
| Jun 23, 1972 | 13.53 |
| Sep 14, 1979 | 13.28 |
| Sep 16, 2005 | 13.18 |
| Dec 27, 2008 | 13 |
| Mar 15, 2007 | 12.85 |
| Sep 23, 2000 | 12.79 |
| Feb 1, 2002 | 12.36 |
| Jan 19, 1996 | 12.3 |
| Nov 7, 2017 | 12.29 |
| Dec 22, 2013 | 12.25 |
| Apr 23, 1977 | 12.05 |
| Jan 8, 1998 | 11.99 |
Data provided by the National Weather Service.