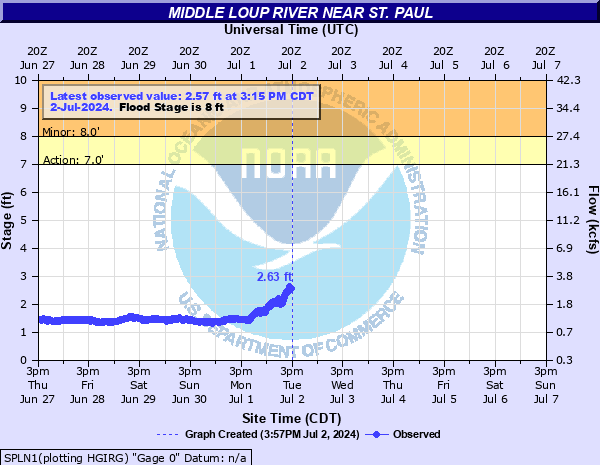
Middle Loup River near St. Paul
Critical Stages
7' - Action
8' - Flood
10' - Moderate
12' - Major
Latest Observation
Updated: 9:15 AM CST 12/14/25
Status: No Flooding
Stage: 1.68 ft
Flow: 1.28 kcfs
Forecast
Forecast not available for this location.
| Time | Stage (ft) | Flow (kcfs) |
|---|---|---|
| 9:15 AM 12/14 | 1.68 | 1.28 |
| 9:00 AM 12/14 | 1.67 | 1.27 |
| 8:45 AM 12/14 | 1.68 | 1.28 |
| 8:30 AM 12/14 | 1.69 | 1.29 |
| 8:15 AM 12/14 | 1.68 | 1.28 |
| 8:00 AM 12/14 | 1.69 | 1.29 |
| 7:55 AM 12/14 | 1.69 | 1.29 |
| 7:50 AM 12/14 | 1.69 | 1.29 |
| 7:45 AM 12/14 | 1.69 | 1.29 |
| 7:30 AM 12/14 | 1.69 | 1.29 |
| 7:15 AM 12/14 | 1.71 | 1.32 |
| 7:00 AM 12/14 | 1.69 | 1.29 |
| 6:45 AM 12/14 | 1.69 | 1.29 |
| 6:30 AM 12/14 | 1.7 | 1.31 |
| 6:15 AM 12/14 | 1.69 | 1.29 |
| 6:00 AM 12/14 | 1.69 | 1.29 |
| 5:45 AM 12/14 | 1.69 | 1.29 |
| 5:30 AM 12/14 | 1.67 | 1.27 |
| 5:15 AM 12/14 | 1.67 | 1.27 |
| 5:00 AM 12/14 | 1.67 | 1.27 |
| 4:45 AM 12/14 | 1.67 | 1.27 |
| 4:30 AM 12/14 | 1.7 | 1.31 |
| 4:15 AM 12/14 | 1.7 | 1.31 |
| 4:00 AM 12/14 | 1.71 | 1.32 |
| 3:45 AM 12/14 | 1.72 | 1.34 |
| 3:30 AM 12/14 | 1.7 | 1.31 |
| 3:15 AM 12/14 | 1.73 | 1.35 |
| 3:00 AM 12/14 | 1.72 | 1.34 |
| 2:45 AM 12/14 | 1.76 | 1.39 |
| 2:30 AM 12/14 | 1.81 | 1.46 |
14.8' -
Water reaches the bottom of the Highway 281 bridge.
12' -
Water will reach the bottom of the railroad bridge. Widespread flooding occurs in lowlands and agricultural lands. The town of Saint Paul is not in the flood plain. There are no major roads or highways in the flood plain. A record flood of 12.69 feet occurred in June of 1947.
10' -
Flooding occurs in lowlands, agricultural areas, and woodlands.
8' -
Flooding occurs in lowlands, agricultural areas, and woodlands adjacent to the river.
| Date | Stage (ft) |
|---|---|
| Jun 23, 1947 | 12.69 |
| Mar 17, 1978 | 12.21 |
| Mar 14, 2019 | 9.54 |
| Jun 15, 1967 | 8.5 |
| Mar 7, 1993 | 8.32 |
| Jun 25, 1968 | 8.28 |
| Feb 14, 1976 | 8.15 |
| Feb 12, 1966 | 7.55 |
| Mar 21, 1969 | 7.43 |
| Mar 10, 1979 | 7.23 |
| Mar 23, 1962 | 7.16 |
| Feb 21, 1964 | 7.12 |
| May 26, 1965 | 7.02 |
| Dec 16, 1962 | 6.98 |
| Mar 10, 1989 | 6.84 |
| Jun 17, 1962 | 6.68 |
| Feb 21, 1982 | 6.61 |
| Mar 6, 1980 | 6.49 |
| Feb 20, 2007 | 6.48 |
| Jun 12, 1984 | 6.46 |
Data provided by the National Weather Service.