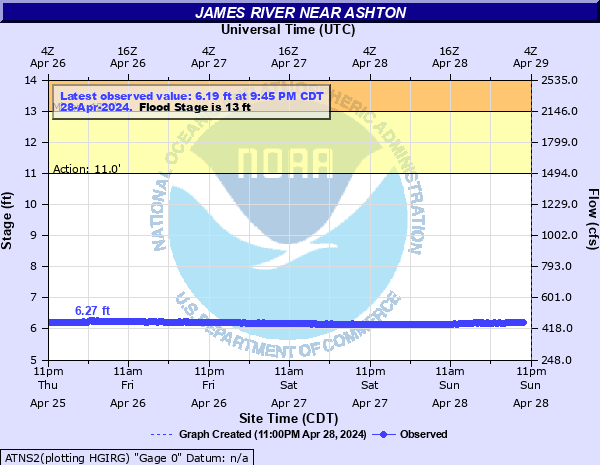
James River near Ashton
Critical Stages
11' - Action
13' - Flood
14' - Moderate
16' - Major
Latest Observation
Updated: 7:45 AM CST 12/16/25
Status: No Flooding
Stage: 5.99 ft
Flow: 0.483 kcfs
Forecast
Forecast not available for this location.
| Time | Stage (ft) | Flow (kcfs) |
|---|---|---|
| 7:45 AM 12/16 | 5.99 | 0.483 |
| 7:30 AM 12/16 | 5.99 | 0.483 |
| 7:15 AM 12/16 | 5.99 | 0.483 |
| 7:00 AM 12/16 | 6 | 0.485 |
| 6:45 AM 12/16 | 5.99 | 0.483 |
| 6:30 AM 12/16 | 5.99 | 0.483 |
| 6:15 AM 12/16 | 6 | 0.485 |
| 6:00 AM 12/16 | 5.99 | 0.483 |
| 5:45 AM 12/16 | 6 | 0.485 |
| 5:30 AM 12/16 | 6 | 0.485 |
| 5:15 AM 12/16 | 6 | 0.485 |
| 5:00 AM 12/16 | 6 | 0.485 |
| 4:45 AM 12/16 | 6 | 0.485 |
| 4:30 AM 12/16 | 6 | 0.485 |
| 4:15 AM 12/16 | 6 | 0.485 |
| 4:00 AM 12/16 | 6.01 | 0.487 |
| 3:45 AM 12/16 | 6.01 | 0.487 |
| 3:30 AM 12/16 | 6 | 0.485 |
| 3:15 AM 12/16 | 6.02 | 0.489 |
| 3:00 AM 12/16 | 6 | 0.485 |
| 2:45 AM 12/16 | 6.01 | 0.487 |
| 2:30 AM 12/16 | 6.01 | 0.487 |
| 2:15 AM 12/16 | 6.02 | 0.489 |
| 2:00 AM 12/16 | 6.01 | 0.487 |
| 1:45 AM 12/16 | 6.02 | 0.489 |
| 1:30 AM 12/16 | 6.01 | 0.487 |
| 1:15 AM 12/16 | 6.02 | 0.489 |
| 1:00 AM 12/16 | 6.02 | 0.489 |
| 12:45 AM 12/16 | 6.01 | 0.487 |
| 12:30 AM 12/16 | 6.02 | 0.489 |
25.5' -
The bridge at the gauging location is overtopped.
22.5' -
The water reaches the bottom of the bridge at the gauging location.
21' -
The main east-west highway begins to flood on the east bank of the river and the water overtops the bridge 2 miles south and 1 mile east of Ashton.
19' -
Water reaches the bottom of the bridge 2 miles south and 1 mile east of Ashton.
16.5' -
The water overtops the bridge 3 miles north and 1 1/2 mile east of Ashton.
15' -
Significant amounts of farm land begin flooding.
14' -
Water reaches the bottom of the bridge 3 miles north and 1 1/2 mile east of Ashton.
13' -
Flooding begins to affect some crop land along with moderate flooding of pasture and low-lying areas.
11' -
Flooding of low-lying pasture and wooded areas begins.
| Date | Stage (ft) |
|---|---|
| Apr 6, 1997 | 26.64 |
| Mar 22, 2010 | 25.25 |
| Apr 28, 2011 | 24.4 |
| Apr 23, 2019 | 23.2 |
| Apr 30, 2009 | 22.96 |
| May 22, 1995 | 21.21 |
| Apr 24, 1969 | 20.63 |
| Apr 21, 2023 | 19.85 |
| Apr 23, 1952 | 19.59 |
| May 19, 1950 | 19.14 |
| Apr 29, 2001 | 18.76 |
| Apr 20, 2020 | 18.36 |
| Jun 9, 2022 | 17.51 |
| May 14, 2007 | 17.39 |
| May 10, 1986 | 16.74 |
| Apr 2, 1994 | 16.23 |
| Jun 11, 1999 | 15.57 |
| May 19, 1996 | 15.26 |
| Apr 14, 1966 | 15.16 |
| May 18, 1979 | 14.86 |
Data provided by the National Weather Service.