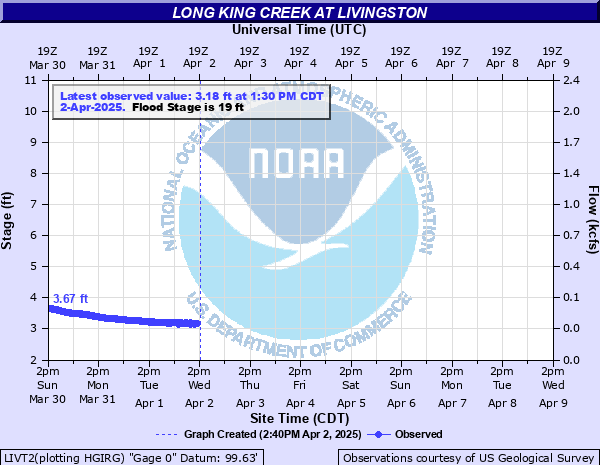
Long King Creek at Livingston
Critical Stages
14' - Action
19' - Flood
25' - Moderate
30' - Major
Latest Observation
Updated: 5:30 PM CST 12/6/25
Status: No Flooding
Stage: 2.65 ft
Flow: 0.008 kcfs
Forecast
Forecast not available for this location.
| Time | Stage (ft) | Flow (kcfs) |
|---|---|---|
| 5:30 PM 12/6 | 2.65 | 0.008 |
| 5:15 PM 12/6 | 2.64 | 0.0078 |
| 5:00 PM 12/6 | 2.64 | 0.0078 |
| 4:45 PM 12/6 | 2.65 | 0.008 |
| 4:30 PM 12/6 | 2.65 | 0.008 |
| 4:15 PM 12/6 | 2.65 | 0.008 |
| 4:00 PM 12/6 | 2.65 | 0.008 |
| 3:45 PM 12/6 | 2.65 | 0.008 |
| 3:30 PM 12/6 | 2.64 | 0.0078 |
| 3:15 PM 12/6 | 2.66 | 0.0082 |
| 3:00 PM 12/6 | 2.66 | 0.0082 |
| 2:45 PM 12/6 | 2.66 | 0.0082 |
| 2:30 PM 12/6 | 2.66 | 0.0082 |
| 2:15 PM 12/6 | 2.66 | 0.0082 |
| 2:00 PM 12/6 | 2.66 | 0.0082 |
| 1:45 PM 12/6 | 2.66 | 0.0082 |
| 1:30 PM 12/6 | 2.66 | 0.0082 |
| 1:15 PM 12/6 | 2.65 | 0.008 |
| 1:00 PM 12/6 | 2.66 | 0.0082 |
| 12:45 PM 12/6 | 2.67 | 0.0083 |
| 12:30 PM 12/6 | 2.68 | 0.0086 |
| 12:15 PM 12/6 | 2.67 | 0.0083 |
| 12:00 PM 12/6 | 2.68 | 0.0086 |
| 11:45 AM 12/6 | 2.68 | 0.0086 |
| 11:30 AM 12/6 | 2.68 | 0.0086 |
| 11:15 AM 12/6 | 2.68 | 0.0086 |
| 11:00 AM 12/6 | 2.69 | 0.0088 |
| 10:45 AM 12/6 | 2.69 | 0.0088 |
| 10:30 AM 12/6 | 2.69 | 0.0088 |
| 10:15 AM 12/6 | 2.69 | 0.0088 |
38' -
At levels above 38 feet, water covers U.S. Highway 190 in the vicinity of the gage with several businesses along the highway flooded.
30' -
At levels above 30 feet, major lowland flooding begins with several businesses along U.S. Highway 190 in the vicinity of the gage threatened.
25' -
At levels above 25 feet, moderate lowland flooding begins as low-lying areas along the creek become inundated.
19' -
At levels above 19 feet, minor lowland flooding begins as water escapes the main channel of the creek.
| Date | Stage (ft) |
|---|---|
| Oct 17, 1994 | 30.49 |
| Aug 28, 2017 | 27.97 |
| May 2, 2024 | 27.42 |
| May 18, 1989 | 27.27 |
| Nov 5, 1973 | 27.06 |
| Oct 16, 2006 | 26.99 |
| Jun 13, 1973 | 26.97 |
| Mar 29, 2018 | 26.77 |
| Nov 18, 2004 | 26.58 |
| Jun 7, 1981 | 26.55 |
| Apr 29, 2024 | 26.39 |
| Jan 7, 1998 | 26.12 |
| May 28, 2016 | 26.07 |
| Mar 11, 2016 | 25.31 |
| Apr 21, 1979 | 25.14 |
| Apr 4, 1999 | 24.95 |
| Dec 8, 2018 | 24.84 |
| Apr 10, 2024 | 24.24 |
| Dec 26, 1994 | 24.15 |
| May 17, 2024 | 23.75 |
Data provided by the National Weather Service.