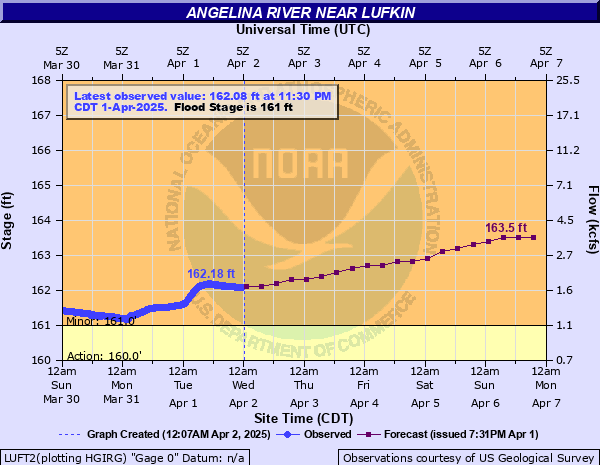
Angelina River near Lufkin
Critical Stages
160' - Action
161' - Flood
171' - Moderate
178' - Major
Latest Observation
Updated: 5:45 PM CST 12/6/25
Status: No Flooding
Stage: 159.25 ft
Flow: 0.481 kcfs
Forecast
Forecast not available for this location.
| Time | Stage (ft) | Flow (kcfs) |
|---|---|---|
| 6:00 PM 12/6 | 159.24 | 0.48 |
| 5:45 PM 12/6 | 159.25 | 0.481 |
| 5:30 PM 12/6 | 159.26 | 0.483 |
| 5:15 PM 12/6 | 159.26 | 0.483 |
| 5:00 PM 12/6 | 159.27 | 0.485 |
| 4:45 PM 12/6 | 159.27 | 0.485 |
| 4:30 PM 12/6 | 159.28 | 0.487 |
| 4:15 PM 12/6 | 159.28 | 0.487 |
| 4:00 PM 12/6 | 159.29 | 0.489 |
| 3:45 PM 12/6 | 159.3 | 0.491 |
| 3:30 PM 12/6 | 159.3 | 0.491 |
| 3:15 PM 12/6 | 159.31 | 0.493 |
| 3:00 PM 12/6 | 159.31 | 0.493 |
| 2:45 PM 12/6 | 159.32 | 0.495 |
| 2:30 PM 12/6 | 159.32 | 0.495 |
| 2:15 PM 12/6 | 159.33 | 0.497 |
| 2:00 PM 12/6 | 159.34 | 0.499 |
| 1:45 PM 12/6 | 159.34 | 0.499 |
| 1:30 PM 12/6 | 159.33 | 0.497 |
| 1:15 PM 12/6 | 159.36 | 0.503 |
| 1:00 PM 12/6 | 159.37 | 0.505 |
| 12:45 PM 12/6 | 159.38 | 0.507 |
| 12:30 PM 12/6 | 159.38 | 0.507 |
| 12:15 PM 12/6 | 159.38 | 0.507 |
| 12:00 PM 12/6 | 159.39 | 0.509 |
| 11:45 AM 12/6 | 159.4 | 0.511 |
| 11:30 AM 12/6 | 159.41 | 0.513 |
| 11:15 AM 12/6 | 159.42 | 0.515 |
| 11:00 AM 12/6 | 159.43 | 0.517 |
| 10:45 AM 12/6 | 159.43 | 0.517 |
179' -
Major flooding including water across the southbound lane of U.S. Highway 59. Expect high water to continue on the lower Angelina River to above Lake Sam Rayburn for several weeks, with flooding of several thousands of acres.
178' -
Expect major flooding including water across the northbound lane of U.S. Highway 59. One can expect high water to continue on the lower Angelina River to above Lake Sam Rayburn to continue for several weeks with several thousands of acres flooded.
177' -
Expect moderate flooding to continue for several more days with seasonal high water and minor flooding to continue for several more weeks as the lower Angelina River above Lake Sam Rayburn slowly recedes.
175' -
Moderate flooding to continue for several weeks on the lower Angelina River to above Lake Sam Rayburn with several thousands of acres flooded. High water begins to fill the ditches of both the northbound and southbound lanes of U.S. Highway 59 to approaching near the emergency lane shoulders.
171' -
Expect moderate flooding with the gravel access roadway completely flooded. High water approaches the tops of the cement support piers on the U.S. Highway 59 bridge with boat traffic under the bridge becoming very difficult with very little clearance. Also expect flooding to continue for several weeks on the lower Angelina River to above Lake Sam Rayburn.
170' -
Expect minor flooding to continue for several more days, as the Angelina River above Lake Sam Rayburn slowly recedes.
168' -
Expect flooding to continue for at least a couple of weeks with the gravel access roadway nearly inundated along its entire length.
165' -
Expect flooding to continue for several days with the majority of the gravel access roadway flooded. Boaters and four wheel-operators should use caution traversing both upstream and downstream on the Angelina River as currents can become swift and turbulent.
162' -
Minor lowland to diminish and end on the lower Angelina River.
161' -
Expect minor flooding with the gravel parking lot flooded and water beginning to overflow the gravel road where it widens into the parking lot. Also expect about a foot of overflow across the left bank of the Angelina River looking downstream.
160' -
Action stage with overflow into the gravel parking lot for boats and trucks on the right bank. Also overflow just begins on the left bank side looking downstream on the Angelina River. Expect overflow into the majority of the gravel parking lot.
158.5' -
Bankfull stage for the right bank of the Angelina River looking downstream. Expect minor overflow into the very edge of the gravel parking lot for boats and trucks.
| Date | Stage (ft) |
|---|---|
| May 24, 1884 | 189.83 |
| May 31, 1908 | 188.33 |
| May 7, 1944 | 183.27 |
| Feb 24, 1932 | 182.98 |
| Nov 28, 1940 | 182.69 |
| Apr 30, 1966 | 182.48 |
| Mar 15, 2016 | 182.17 |
| May 19, 1953 | 181.2 |
| May 5, 2016 | 180.72 |
| May 2, 1957 | 180.64 |
| Apr 7, 1945 | 179.9 |
| Mar 16, 2015 | 179.72 |
| Dec 14, 1960 | 179.41 |
| May 10, 1959 | 178.75 |
| Mar 8, 1934 | 178.7 |
| Oct 31, 1941 | 178.64 |
| Apr 15, 1927 | 178.57 |
| May 21, 1930 | 178.39 |
| Mar 23, 1969 | 178.3 |
| May 8, 1958 | 178.22 |
Data provided by the National Weather Service.