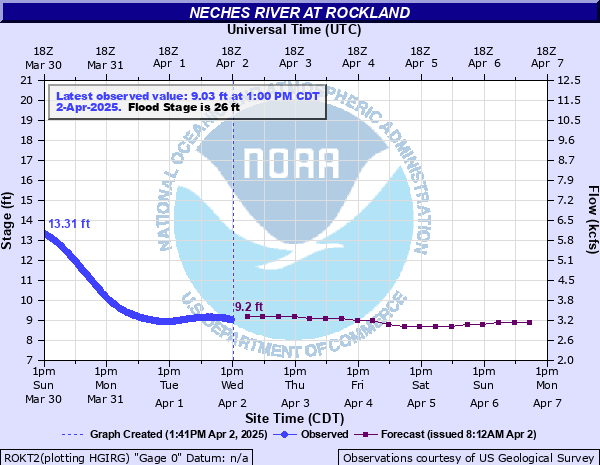
Neches River at Rockland
Critical Stages
25' - Action
26' - Flood
30' - Moderate
33' - Major
Latest Observation
Updated: 5:00 PM CST 12/6/25
Status: No Flooding
Stage: 5.13 ft
Flow: 0.913 kcfs
Forecast
| Time | Stage (ft) | Flow (kcfs) |
|---|---|---|
| 12 AM 12/7 | 5.2 | 0.949 |
| 6 AM 12/7 | 5.1 | 0.898 |
| 12 PM 12/7 | 5.1 | 0.898 |
| 6 PM 12/7 | 5.1 | 0.898 |
| 12 AM 12/8 | 5.1 | 0.898 |
| 6 AM 12/8 | 5 | 0.849 |
| 12 PM 12/8 | 5 | 0.849 |
| 6 PM 12/8 | 5 | 0.849 |
| 12 AM 12/9 | 5 | 0.849 |
| 6 AM 12/9 | 4.9 | 0.797 |
| 12 PM 12/9 | 4.9 | 0.797 |
| 6 PM 12/9 | 4.9 | 0.797 |
| 12 AM 12/10 | 4.9 | 0.797 |
| 6 AM 12/10 | 4.8 | 0.746 |
| 12 PM 12/10 | 4.8 | 0.746 |
| 6 PM 12/10 | 4.8 | 0.746 |
| 12 AM 12/11 | 4.8 | 0.746 |
| 6 AM 12/11 | 4.7 | 0.697 |
| Time | Stage (ft) | Flow (kcfs) |
|---|---|---|
| 6:00 PM 12/6 | 5.11 | 0.903 |
| 5:45 PM 12/6 | 5.12 | 0.908 |
| 5:30 PM 12/6 | 5.12 | 0.908 |
| 5:15 PM 12/6 | 5.12 | 0.908 |
| 5:00 PM 12/6 | 5.13 | 0.913 |
| 4:45 PM 12/6 | 5.13 | 0.913 |
| 4:30 PM 12/6 | 5.13 | 0.913 |
| 4:15 PM 12/6 | 5.13 | 0.913 |
| 4:00 PM 12/6 | 5.13 | 0.913 |
| 3:45 PM 12/6 | 5.13 | 0.913 |
| 3:30 PM 12/6 | 5.14 | 0.918 |
| 3:15 PM 12/6 | 5.14 | 0.918 |
| 3:00 PM 12/6 | 5.14 | 0.918 |
| 2:45 PM 12/6 | 5.14 | 0.918 |
| 2:30 PM 12/6 | 5.15 | 0.923 |
| 2:15 PM 12/6 | 5.15 | 0.923 |
| 2:00 PM 12/6 | 5.16 | 0.928 |
| 1:45 PM 12/6 | 5.16 | 0.928 |
| 1:30 PM 12/6 | 5.16 | 0.928 |
| 1:15 PM 12/6 | 5.16 | 0.928 |
| 1:00 PM 12/6 | 5.15 | 0.923 |
| 12:45 PM 12/6 | 5.16 | 0.928 |
| 12:30 PM 12/6 | 5.16 | 0.928 |
| 12:15 PM 12/6 | 5.17 | 0.934 |
| 12:00 PM 12/6 | 5.17 | 0.934 |
| 11:45 AM 12/6 | 5.17 | 0.934 |
| 11:30 AM 12/6 | 5.17 | 0.934 |
| 11:15 AM 12/6 | 5.18 | 0.939 |
| 11:00 AM 12/6 | 5.17 | 0.934 |
| 10:45 AM 12/6 | 5.17 | 0.934 |
36' -
Up to forty homes in the Fox Landing community will be flooded. Expect flooding of thousands of acres of lowlands.
32' -
Some dozen homes in the Fox Landing community will be flooded. Preparations should be rushed to completion to protect homes and property from being flooded.
30' -
High water will flood and close several roadways especially in the Fox Landing community. Some low area homes in the Fox Landing community will also be threatened with flooding.
28' -
Water will begin to flood several secondary roadways especially in the Fox Landing community.
26' -
Minor lowland flooding.
| Date | Stage (ft) |
|---|---|
| May 1, 1884 | 38 |
| Apr 11, 1945 | 35.49 |
| May 6, 1944 | 35.04 |
| Jun 1, 1929 | 33.89 |
| Feb 24, 1932 | 33.89 |
| Oct 20, 1994 | 33.29 |
| Jul 2, 1989 | 33.2 |
| Nov 30, 1940 | 32.59 |
| Apr 2, 1922 | 32.2 |
| May 22, 1935 | 32.2 |
| Sep 1, 2017 | 32.12 |
| Dec 2, 1941 | 31.99 |
| May 20, 1953 | 30.7 |
| Jan 27, 1920 | 30.4 |
| May 19, 1929 | 30.39 |
| Apr 12, 1938 | 29.89 |
| Apr 26, 1926 | 29.79 |
| May 31, 2016 | 29.64 |
| Feb 13, 1946 | 29.6 |
| Apr 16, 1921 | 29.59 |
Data provided by the National Weather Service.