Trinity River at Riverside
Critical Stages
132' - Action
133.5' - Flood
136' - Moderate
140' - Major
Latest Observation
Updated: 5:30 PM CST 12/6/25
Status: No Flooding
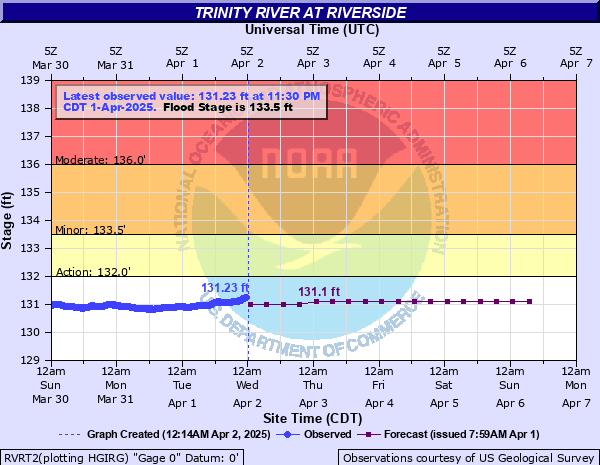
Stage: 130.95 ft
Flow: 59.5 kcfs
Forecast
| Time | Stage (ft) | Flow (kcfs) |
|---|---|---|
| 12 AM 12/7 | 131 | 59.6 |
| 6 AM 12/7 | 131 | 59.6 |
| 12 PM 12/7 | 131 | 59.6 |
| 6 PM 12/7 | 131 | 59.6 |
| 12 AM 12/8 | 131 | 59.6 |
| 6 AM 12/8 | 131 | 59.6 |
| 12 PM 12/8 | 131 | 59.6 |
| 6 PM 12/8 | 131 | 59.6 |
| 12 AM 12/9 | 131 | 59.6 |
| 6 AM 12/9 | 131 | 59.6 |
| 12 PM 12/9 | 131 | 59.6 |
| 6 PM 12/9 | 131 | 59.6 |
| 12 AM 12/10 | 131 | 59.6 |
| 6 AM 12/10 | 131 | 59.6 |
| 12 PM 12/10 | 131 | 59.6 |
| 6 PM 12/10 | 131 | 59.6 |
| 12 AM 12/11 | 130.9 | 59.3 |
| 6 AM 12/11 | 130.9 | 59.3 |
| Time | Stage (ft) | Flow (kcfs) |
|---|---|---|
| 5:30 PM 12/6 | 130.95 | 59.5 |
| 5:15 PM 12/6 | 130.96 | 59.5 |
| 5:00 PM 12/6 | 130.96 | 59.5 |
| 4:45 PM 12/6 | 130.96 | 59.5 |
| 4:30 PM 12/6 | 130.96 | 59.5 |
| 4:15 PM 12/6 | 130.96 | 59.5 |
| 4:00 PM 12/6 | 130.97 | 59.5 |
| 3:45 PM 12/6 | 130.97 | 59.5 |
| 3:30 PM 12/6 | 130.97 | 59.5 |
| 3:15 PM 12/6 | 130.97 | 59.5 |
| 3:00 PM 12/6 | 130.97 | 59.5 |
| 2:45 PM 12/6 | 130.97 | 59.5 |
| 2:30 PM 12/6 | 130.98 | 59.5 |
| 2:15 PM 12/6 | 130.98 | 59.5 |
| 2:00 PM 12/6 | 130.98 | 59.5 |
| 1:45 PM 12/6 | 130.97 | 59.5 |
| 1:30 PM 12/6 | 130.98 | 59.5 |
| 1:15 PM 12/6 | 130.97 | 59.5 |
| 1:00 PM 12/6 | 130.97 | 59.5 |
| 12:45 PM 12/6 | 130.96 | 59.5 |
| 12:30 PM 12/6 | 130.97 | 59.5 |
| 12:15 PM 12/6 | 130.96 | 59.5 |
| 12:00 PM 12/6 | 130.96 | 59.5 |
| 11:45 AM 12/6 | 130.96 | 59.5 |
| 11:30 AM 12/6 | 130.96 | 59.5 |
| 11:15 AM 12/6 | 130.96 | 59.5 |
| 11:00 AM 12/6 | 130.94 | 59.4 |
| 10:45 AM 12/6 | 130.95 | 59.5 |
| 10:30 AM 12/6 | 130.96 | 59.5 |
| 10:15 AM 12/6 | 130.96 | 59.5 |
140' -
Major lowland flooding begins with widespread flooding in Trinity and Walker Counties. Water is in several homes in the Deep River Plantation and Green Rich Shores subdivisions. Roads into several subdivisions in Walker and Trinity Counties and secondary roads along the river are inundated.
138' -
Moderate lowland flooding continues with water 3 to 4 feet below the State Highway 19 Bridge and Plantation Drive near FM 230 is inundated. FM 2978 is flooded and impassable. Up to one foot of water is flowing over Thomas Lake Road which remains impassable. Several roads into the Green Rich Shores and Deep River Plantation subdivisions are covered with up to one foot of water and homes in Deep River Plantation are threatened.
137' -
Moderate lowland flooding continues as several homes in the Green Rich Shores Subdivision in Walker County flood and water covers Thomas Lake Road. The lowest buildings off FM 980 northwest of Riverside flood.
136.8' -
Moderate lowland flooding continues as the approaches to the FM 3478 bridge upstream of the gage are inundated and impassable. The lowest homes in the Green Rich Shores Subdivision are flooded with up to one half foot of water. Thomas Lake Road remains flooded and the lowest roads into properties off FM 980 northwest of Riverside are inundated and impassable.
136' -
Moderate lowland flooding begins in the vicinity of the gage. The lowest homes in the Green Rich Shores Subdivision are flooded and Thomas Lake Road is inundated and impassable. Low-lying roads in the Deep River Plantation Subdivision are inundated. The lowest roads into properties off FM 980 northwest of Riverside are inundated and the lowest buildings are threatened.
135' -
Minor lowland flooding continues as significant backwater up Thomas Lake floods the lowest areas in the Green Rich Shore Subdivision in Walker County with the boat ramp completely inundated. The lowest lying areas in the Deep River Plantation Subdivision and FM 980 northwest of Riverside are threatened.
134' -
Minor lowland flooding continues with the boat ramp in the Deep River Plantation Subdivision in Walker County inundated. Backwater flooding up Thomas Lake in Walker County floods the boat ramp in the Green Rich Shores Subdivision in Walker County.
133.5' -
Minor lowland flooding begins in the vicinity of the gage with water in the Green Rich Shores subdivision. Backwater flooding up Wright's Creek impacts Plantation Drive in the Deep River Plantation subdivision.
132' -
Bankfull stage. Water begins to overflow the main channel in the vicinity of the gage.
| Date | Stage (ft) |
|---|---|
| May 5, 1942 | 142.61 |
| Apr 9, 1945 | 141.69 |
| May 5, 2024 | 140.4 |
| May 4, 1957 | 139.61 |
| Jun 11, 1908 | 139.56 |
| Oct 18, 2018 | 138.93 |
| Jun 6, 2015 | 138.12 |
| Jun 15, 2024 | 137.67 |
| Jul 18, 2007 | 137.67 |
| Aug 29, 2017 | 137.66 |
| May 11, 1944 | 137.6 |
| May 29, 2015 | 137.56 |
| May 29, 2016 | 137.49 |
| Jan 12, 2019 | 137.05 |
| May 12, 2019 | 136.83 |
| May 25, 2019 | 136.83 |
| Mar 21, 2016 | 136.72 |
| Dec 10, 2018 | 136.54 |
| Jun 9, 2021 | 136.46 |
| Jun 29, 2004 | 135.7 |
Data provided by the National Weather Service.