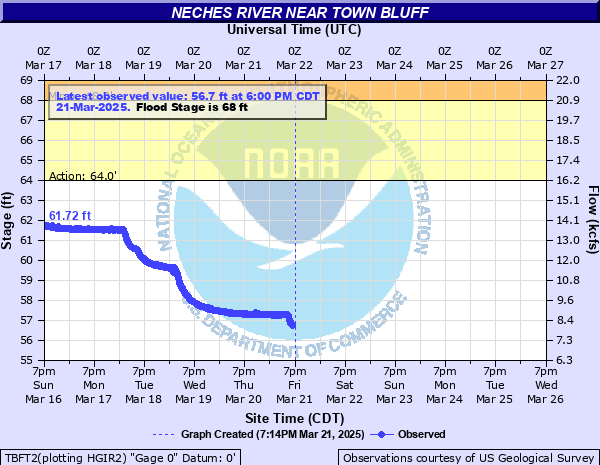
Neches River near Town Bluff
Critical Stages
64' - Action
68' - Flood
72' - Moderate
82.5' - Major
Latest Observation
Updated: 5:00 PM CST 12/6/25
Status: No Flooding
Stage: 51.99 ft
Flow: 3.66 kcfs
Forecast
Forecast not available for this location.
| Time | Stage (ft) | Flow (kcfs) |
|---|---|---|
| 6:00 PM 12/6 | 51.99 | 3.66 |
| 5:45 PM 12/6 | 51.98 | 3.65 |
| 5:30 PM 12/6 | 51.99 | 3.66 |
| 5:15 PM 12/6 | 51.99 | 3.66 |
| 5:00 PM 12/6 | 51.99 | 3.66 |
| 4:45 PM 12/6 | 51.99 | 3.66 |
| 4:30 PM 12/6 | 51.99 | 3.66 |
| 4:15 PM 12/6 | 52 | 3.67 |
| 4:00 PM 12/6 | 52 | 3.67 |
| 3:45 PM 12/6 | 52 | 3.67 |
| 3:30 PM 12/6 | 51.99 | 3.66 |
| 3:15 PM 12/6 | 52 | 3.67 |
| 3:00 PM 12/6 | 52 | 3.67 |
| 2:45 PM 12/6 | 52 | 3.67 |
| 2:30 PM 12/6 | 52.01 | 3.67 |
| 2:15 PM 12/6 | 52 | 3.67 |
| 2:00 PM 12/6 | 52 | 3.67 |
| 1:45 PM 12/6 | 52 | 3.67 |
| 1:30 PM 12/6 | 52 | 3.67 |
| 1:15 PM 12/6 | 52 | 3.67 |
| 1:00 PM 12/6 | 52.01 | 3.67 |
| 12:45 PM 12/6 | 52 | 3.67 |
| 12:30 PM 12/6 | 52.01 | 3.67 |
| 12:15 PM 12/6 | 52.01 | 3.67 |
| 12:00 PM 12/6 | 52.01 | 3.67 |
| 11:45 AM 12/6 | 52.01 | 3.67 |
| 11:30 AM 12/6 | 52.02 | 3.68 |
| 11:15 AM 12/6 | 52.02 | 3.68 |
| 11:00 AM 12/6 | 52.01 | 3.67 |
| 10:45 AM 12/6 | 52.02 | 3.68 |
86.81' -
The river is at flood of record. Widespread major to catastrophic flooding will occur.
81.5' -
Major flooding occurring with water reaching the instrument shelf.
78.7' -
Moderate flooding will occur with flood waters reaching the floor of the instrument shelter.
76' -
Some of the lowest homes in Sheffield's ferry become threatened.
75' -
Considerable flooding of several county and private roads below the dam.
73' -
Flooding expected in the Mont Neches, Barlow Lake and Sheffields Ferry communities.
70' -
Flooding can be expected around Barlow Lake and Brushy Lake with some roads being cutoff and some of the lowest properties near the river begin to flood.
65' -
Areas around Barlow Lake and Brushy Lake begin to flood.
64' -
Minor flooding will occur.
62' -
The river is at bankfull stage.
| Date | Stage (ft) |
|---|---|
| May 1, 1884 | 86.8 |
| May 6, 1944 | 84.98 |
| May 21, 1953 | 82.85 |
| May 22, 1935 | 82.56 |
| Aug 31, 2017 | 80.7 |
| Jul 2, 1989 | 78.49 |
| May 18, 2021 | 77.91 |
| Oct 23, 1994 | 76.17 |
| May 17, 2024 | 76.17 |
| Mar 11, 2016 | 76.12 |
| Jun 3, 2016 | 75.65 |
| Mar 30, 2018 | 75.57 |
| Jan 4, 2019 | 74.8 |
| Feb 12, 1984 | 73.5 |
| May 29, 2015 | 73.5 |
| Mar 14, 1999 | 73.45 |
| Jun 17, 2001 | 73.16 |
| Nov 26, 1986 | 72.43 |
| Oct 20, 2006 | 72.25 |
| Jan 8, 1998 | 71.46 |
Data provided by the National Weather Service.