Little River near Washington
Critical Stages
16' - Action
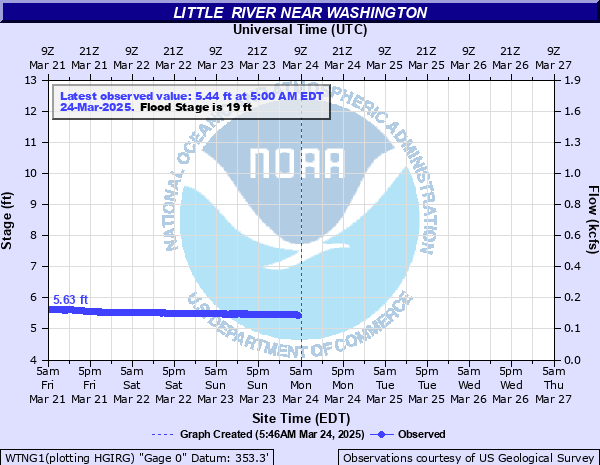
19' - Flood
24' - Moderate
28' - Major
Latest Observation
Updated: 5:00 AM EST 12/8/25
Status: No Flooding
Stage: 5.38 ft
Flow: 0.12 kcfs
Forecast
Forecast not available for this location.
| Time | Stage (ft) | Flow (kcfs) |
|---|---|---|
| 5:00 AM 12/8 | 5.38 | 0.12 |
| 4:45 AM 12/8 | 5.38 | 0.12 |
| 4:30 AM 12/8 | 5.38 | 0.12 |
| 4:15 AM 12/8 | 5.38 | 0.12 |
| 4:00 AM 12/8 | 5.39 | 0.121 |
| 3:45 AM 12/8 | 5.39 | 0.121 |
| 3:30 AM 12/8 | 5.39 | 0.121 |
| 3:15 AM 12/8 | 5.39 | 0.121 |
| 3:00 AM 12/8 | 5.39 | 0.121 |
| 2:45 AM 12/8 | 5.4 | 0.123 |
| 2:30 AM 12/8 | 5.4 | 0.123 |
| 2:15 AM 12/8 | 5.4 | 0.123 |
| 2:00 AM 12/8 | 5.41 | 0.124 |
| 1:45 AM 12/8 | 5.4 | 0.123 |
| 1:30 AM 12/8 | 5.4 | 0.123 |
| 1:15 AM 12/8 | 5.41 | 0.124 |
| 1:00 AM 12/8 | 5.41 | 0.124 |
| 12:45 AM 12/8 | 5.41 | 0.124 |
| 12:30 AM 12/8 | 5.41 | 0.124 |
| 12:15 AM 12/8 | 5.41 | 0.124 |
| 12:00 AM 12/8 | 5.42 | 0.125 |
| 11:45 PM 12/7 | 5.42 | 0.125 |
| 11:30 PM 12/7 | 5.42 | 0.125 |
| 11:15 PM 12/7 | 5.42 | 0.125 |
| 11:00 PM 12/7 | 5.42 | 0.125 |
| 10:45 PM 12/7 | 5.42 | 0.125 |
| 10:30 PM 12/7 | 5.43 | 0.126 |
| 10:15 PM 12/7 | 5.42 | 0.125 |
| 10:00 PM 12/7 | 5.43 | 0.126 |
| 9:45 PM 12/7 | 5.43 | 0.126 |
27' -
Significant flooding continues in the woodlands and fields along the river upstream and downstream from the gage at Lundberg Road.
25' -
Moderate flooding occurs in the woodlands and fields along the river upstream and downstream from the gage at Lundberg Road.
23' -
Minor flooding expands further into the woodlands and fields along the river upstream and downstream from the gage at Lundberg Road.
21' -
Minor flooding continues in the woodlands and fields along the river upstream and downstream from the gage at Lundberg Road.
19' -
Flood stage is reached. Minor flooding occurs in the woodlands and fields along the river upstream and downstream from the gage at Lundberg Road.
16' -
Bankfull conditions occur upstream and downstream from the gage at Lundberg Road.
| Date | Stage (ft) |
|---|---|
| Jun 13, 2001 | 28.38 |
| Mar 3, 1971 | 27.93 |
| May 3, 1964 | 27.84 |
| Mar 4, 1952 | 27.6 |
| Dec 27, 1964 | 27.56 |
| Apr 7, 2022 | 27.53 |
| Dec 24, 2015 | 27.47 |
| Feb 7, 2020 | 26.42 |
| Sep 28, 2024 | 24.89 |
| Jan 14, 2020 | 24.26 |
| Dec 30, 2013 | 22.97 |
| Mar 29, 2009 | 22.66 |
| May 6, 2013 | 22.53 |
| Mar 1, 2009 | 22.45 |
| Sep 18, 2020 | 22.22 |
| Jan 5, 2019 | 22.08 |
| Nov 12, 2009 | 22.07 |
| Dec 24, 2013 | 21.53 |
| Nov 15, 2018 | 21.07 |
| Jan 1, 2016 | 20.71 |
Data provided by the National Weather Service.