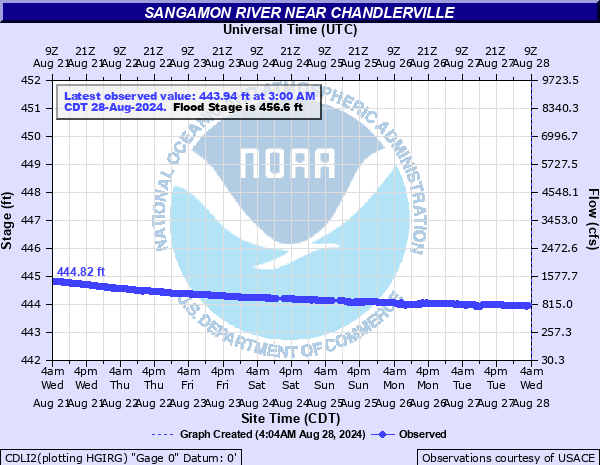
Sangamon River near Chandlerville
Critical Stages
454' - Action
456.6' - Flood
459' - Moderate
462' - Major
Latest Observation
Updated: 11:00 AM CST 12/16/25
Status: No Flooding
Stage: 443.48 ft
Flow: 0.468 kcfs
Forecast
Forecast not available for this location.
| Time | Stage (ft) | Flow (kcfs) |
|---|---|---|
| 11:00 AM 12/16 | 443.48 | 0.468 |
| 10:45 AM 12/16 | 443.44 | 0.449 |
| 10:30 AM 12/16 | 443.43 | 0.444 |
| 10:15 AM 12/16 | 443.41 | 0.435 |
| 10:00 AM 12/16 | 443.38 | 0.421 |
| 9:45 AM 12/16 | 443.36 | 0.412 |
| 9:30 AM 12/16 | 443.34 | 0.403 |
| 9:15 AM 12/16 | 443.32 | 0.394 |
| 9:00 AM 12/16 | 443.31 | 0.39 |
| 8:45 AM 12/16 | 443.31 | 0.39 |
| 8:30 AM 12/16 | 443.3 | 0.386 |
| 8:15 AM 12/16 | 443.3 | 0.386 |
| 8:00 AM 12/16 | 443.3 | 0.386 |
| 7:45 AM 12/16 | 443.3 | 0.386 |
| 7:30 AM 12/16 | 443.3 | 0.386 |
| 7:15 AM 12/16 | 443.3 | 0.386 |
| 7:00 AM 12/16 | 443.3 | 0.386 |
| 6:45 AM 12/16 | 443.3 | 0.386 |
| 6:30 AM 12/16 | 443.29 | 0.382 |
| 6:15 AM 12/16 | 443.28 | 0.378 |
| 6:00 AM 12/16 | 443.26 | 0.37 |
| 5:45 AM 12/16 | 443.25 | 0.366 |
| 5:30 AM 12/16 | 443.23 | 0.358 |
| 5:15 AM 12/16 | 443.21 | 0.351 |
| 5:00 AM 12/16 | 443.19 | 0.343 |
| 4:45 AM 12/16 | 443.16 | 0.333 |
| 4:30 AM 12/16 | 443.12 | 0.319 |
| 4:15 AM 12/16 | 443.11 | 0.315 |
| 4:00 AM 12/16 | 443.11 | 0.315 |
| 3:45 AM 12/16 | 443.14 | 0.326 |
466.9' -
Water overtops the Old River Levee.
463.9' -
Water overtops the Chandlerville City Levee.
461.5' -
Water overtops the Bell Levee.
461' -
Water overtops the South Sangamon West Levee at the pump station.
459.9' -
Flooding begins to impact some residences in Chandlerville.
| Date | Stage (ft) |
|---|---|
| Jan 2, 2016 | 463.2 |
| May 16, 2002 | 462.7 |
| May 5, 2019 | 461.07 |
| Jun 11, 2008 | 461.03 |
| Nov 2, 2009 | 460.3 |
| May 21, 2020 | 460.23 |
| Jun 30, 2015 | 459.81 |
| Jan 26, 2024 | 459.75 |
| Jul 14, 2015 | 459.71 |
| Jun 30, 2021 | 459.6 |
| Apr 24, 2013 | 459.57 |
| May 2, 2020 | 459.52 |
| Jun 26, 2010 | 459.15 |
| May 19, 2009 | 458.87 |
| Sep 18, 2008 | 458.71 |
| Feb 8, 2008 | 458.7 |
| Dec 28, 2009 | 458.65 |
| Nov 22, 2009 | 458.54 |
| May 7, 2017 | 458.45 |
| Jun 26, 2019 | 458.23 |
Data provided by the National Weather Service.