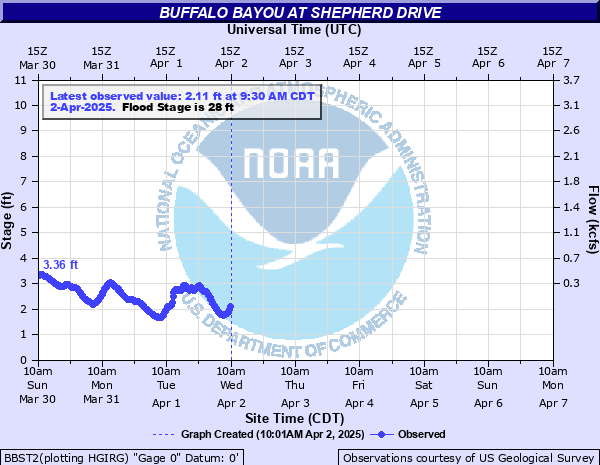
Buffalo Bayou at Shepherd Drive
Critical Stages
17' - Action
28' - Flood
29.5' - Moderate
32' - Major
Latest Observation
Updated: 1:30 AM CST 12/15/25
Status: No Flooding
Stage: 1.2 ft
Flow: -999 kcfs
Forecast
Forecast not available for this location.
| Time | Stage (ft) | Flow (kcfs) |
|---|---|---|
| 1:30 AM 12/15 | 1.2 | -999 |
| 1:15 AM 12/15 | 1.17 | -999 |
| 1:00 AM 12/15 | 1.18 | -999 |
| 12:45 AM 12/15 | 1.21 | -999 |
| 12:30 AM 12/15 | 1.25 | -999 |
| 12:15 AM 12/15 | 1.3 | -999 |
| 12:00 AM 12/15 | 1.34 | -999 |
| 11:45 PM 12/14 | 1.39 | -999 |
| 11:30 PM 12/14 | 1.44 | -999 |
| 11:15 PM 12/14 | 1.48 | -999 |
| 11:00 PM 12/14 | 1.51 | -999 |
| 10:45 PM 12/14 | 1.53 | -999 |
| 10:30 PM 12/14 | 1.53 | -999 |
| 10:15 PM 12/14 | 1.51 | -999 |
| 10:00 PM 12/14 | 1.45 | -999 |
| 9:45 PM 12/14 | 1.36 | -999 |
| 9:30 PM 12/14 | 1.25 | -999 |
| 9:15 PM 12/14 | 1.17 | -999 |
| 9:00 PM 12/14 | 1.08 | -999 |
| 8:45 PM 12/14 | 1.01 | -999 |
| 8:30 PM 12/14 | 1 | -999 |
| 8:15 PM 12/14 | 0.98 | -999 |
| 8:00 PM 12/14 | 0.97 | -999 |
| 7:45 PM 12/14 | 0.95 | -999 |
| 7:30 PM 12/14 | 0.94 | -999 |
| 7:15 PM 12/14 | 0.91 | -999 |
| 7:00 PM 12/14 | 0.89 | -999 |
| 6:45 PM 12/14 | 0.88 | -999 |
| 6:30 PM 12/14 | 0.85 | -999 |
| 6:15 PM 12/14 | 0.86 | -999 |
32' -
At levels above 32.0 feet, major flooding begins as portions of Allen Parkway and Memorial Drive are under 1 to 2 feet of water and homes upstream of the gage begin flooding.
29.5' -
At levels above 29.5 feet, moderate lowland flooding begins Memorial Drive between Sandman Streeet and Waugh Drive becomes inundated.
28.7' -
At levels above 28.7 feet, Allen Parkway east of Montrose Boulevard and Memorial Drive east of Waugh Drive flood.
28' -
At levels above 28.0 feet, minor lowland flooding begins as water spills out of main channel and floods the lowest levels of apartments near the gage.
17' -
At levels above 17.0 feet, hike and bike trails within the channel become inundated.
| Date | Stage (ft) |
|---|---|
| Aug 28, 2017 | 41.9 |
| Jun 9, 2001 | 36.58 |
| Sep 11, 1998 | 36.33 |
| Mar 4, 1992 | 34.63 |
| May 26, 2015 | 33.64 |
| Sep 13, 2008 | 31.97 |
| Apr 18, 2016 | 31.7 |
| Sep 19, 2019 | 31.27 |
| Sep 19, 2019 | 31.06 |
| Aug 30, 1945 | 30.15 |
| May 18, 1989 | 30 |
| Nov 17, 2003 | 29.08 |
| Apr 28, 2009 | 27.99 |
| Oct 16, 2006 | 27.47 |
| Mar 28, 2001 | 27.03 |
| Oct 18, 1994 | 26.85 |
| Aug 31, 1981 | 26.4 |
| Aug 18, 1983 | 25.67 |
| Mar 12, 1997 | 25.14 |
| Nov 18, 2003 | 24.32 |
Data provided by the National Weather Service.