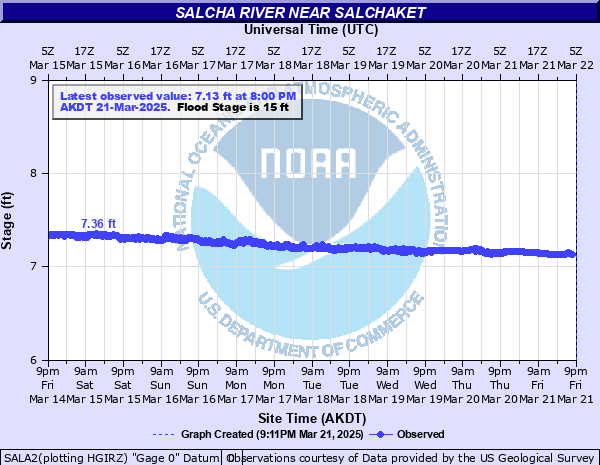
Salcha River near Salchaket
Critical Stages
13' - Action
15' - Flood
18' - Moderate
Major
Latest Observation
Updated: 8:00 AM AKST 12/16/25
Status: No Flooding
Stage: 6 ft
Flow: 0.851 kcfs
Forecast
Forecast not available for this location.
| Time | Stage (ft) | Flow (kcfs) |
|---|---|---|
| 9:00 PM 12/16 | -9999 | -999 |
| 8:45 PM 12/16 | -9999 | -999 |
| 8:30 PM 12/16 | -9999 | -999 |
| 8:15 PM 12/16 | -9999 | -999 |
| 8:00 PM 12/16 | -9999 | -999 |
| 7:45 PM 12/16 | -9999 | -999 |
| 7:30 PM 12/16 | -9999 | -999 |
| 7:15 PM 12/16 | -9999 | -999 |
| 7:00 PM 12/16 | -9999 | -999 |
| 6:45 PM 12/16 | -9999 | -999 |
| 6:30 PM 12/16 | -9999 | -999 |
| 6:15 PM 12/16 | -9999 | -999 |
| 6:00 PM 12/16 | -9999 | -999 |
| 5:45 PM 12/16 | -9999 | -999 |
| 5:30 PM 12/16 | -9999 | -999 |
| 5:15 PM 12/16 | -9999 | -999 |
| 5:00 PM 12/16 | -9999 | -999 |
| 4:45 PM 12/16 | -9999 | -999 |
| 4:30 PM 12/16 | -9999 | -999 |
| 4:15 PM 12/16 | -9999 | -999 |
| 4:00 PM 12/16 | -9999 | -999 |
| 3:45 PM 12/16 | -9999 | -999 |
| 3:30 PM 12/16 | -9999 | -999 |
| 3:15 PM 12/16 | -9999 | -999 |
| 3:00 PM 12/16 | -9999 | -999 |
| 2:45 PM 12/16 | -9999 | -999 |
| 2:30 PM 12/16 | -9999 | -999 |
| 2:15 PM 12/16 | -9999 | -999 |
| 2:00 PM 12/16 | -9999 | -999 |
| 1:45 PM 12/16 | -9999 | -999 |
21.78' -
Flood of record of 1967. Highest record level of water at this point.
18.7' -
In August 1986...a crest of 18.7 feet was associated with the worst flooding on the Salcha River since the great flood of 1967. Long time residents on the Upper Salcha said that the crest came within inches of the 1967 crest. Aerial reconnaissance on Aug 23 showed many residences on the Lower Salcha and many cabins on the Upper Salcha to be flooded. The Salcha campground was completely flooded. Vehicles left there were in deep water. In spots...water was 5 feet deep in the subdivision below the bridge.
14' -
Flood stage at left bank of campground. Roads between the hwy and the Tanana River start to have water on them.
13' -
Bankfull level at campground on left bank.
| Date | Stage (ft) |
|---|---|
| Aug 14, 1967 | 21.78 |
| Aug 23, 1986 | 18.67 |
| Jun 20, 2014 | 18.38 |
| Jun 24, 2020 | 17.29 |
| Jul 30, 2008 | 16.9 |
| Aug 15, 2000 | 16.81 |
| Jun 27, 1989 | 16.44 |
| Aug 19, 2002 | 16.4 |
| Jun 23, 1956 | 16.13 |
| May 14, 1975 | 15.85 |
| May 28, 1992 | 15.65 |
| Jun 6, 2013 | 15.61 |
| Aug 18, 2019 | 15.38 |
| Jun 17, 1984 | 15.35 |
| Sep 3, 2003 | 15.35 |
| Jun 28, 1995 | 15.29 |
| May 10, 1950 | 15.1 |
| Jun 25, 2006 | 15 |
| May 1, 2011 | 14.93 |
| May 27, 2012 | 14.9 |
Data provided by the National Weather Service.