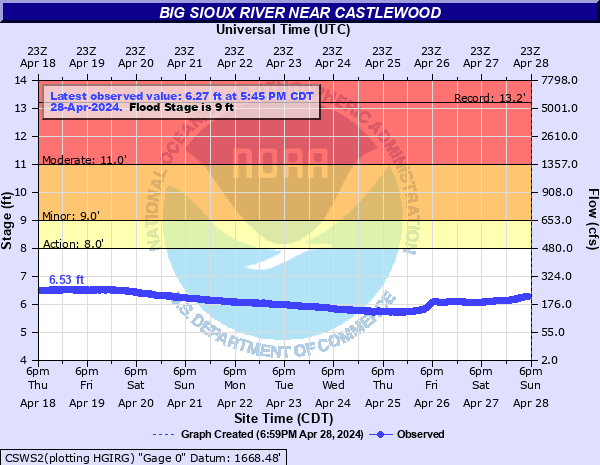
Big Sioux River near Castlewood
Critical Stages
8' - Action
9' - Flood
11' - Moderate
16' - Major
Latest Observation
Updated: 4:45 PM CST 12/15/25
Status: No Flooding
Stage: 5.82 ft
Flow: 0.15 kcfs
Forecast
Forecast not available for this location.
| Time | Stage (ft) | Flow (kcfs) |
|---|---|---|
| 4:45 PM 12/15 | 5.82 | 0.15 |
| 4:30 PM 12/15 | 5.83 | 0.151 |
| 4:15 PM 12/15 | 5.82 | 0.15 |
| 4:00 PM 12/15 | 5.81 | 0.148 |
| 3:45 PM 12/15 | 5.81 | 0.148 |
| 3:30 PM 12/15 | 5.82 | 0.15 |
| 3:15 PM 12/15 | 5.82 | 0.15 |
| 3:00 PM 12/15 | 5.82 | 0.15 |
| 2:45 PM 12/15 | 5.82 | 0.15 |
| 2:30 PM 12/15 | 5.82 | 0.15 |
| 2:15 PM 12/15 | 5.83 | 0.151 |
| 2:00 PM 12/15 | 5.82 | 0.15 |
| 1:45 PM 12/15 | 5.83 | 0.151 |
| 1:30 PM 12/15 | 5.83 | 0.151 |
| 1:15 PM 12/15 | 5.83 | 0.151 |
| 1:00 PM 12/15 | 5.83 | 0.151 |
| 12:45 PM 12/15 | 5.83 | 0.151 |
| 12:30 PM 12/15 | 5.83 | 0.151 |
| 12:15 PM 12/15 | 5.84 | 0.152 |
| 12:00 PM 12/15 | 5.84 | 0.152 |
| 11:45 AM 12/15 | 5.84 | 0.152 |
| 11:30 AM 12/15 | 5.84 | 0.152 |
| 11:15 AM 12/15 | 5.84 | 0.152 |
| 11:00 AM 12/15 | 5.84 | 0.152 |
| 10:45 AM 12/15 | 5.83 | 0.151 |
| 10:30 AM 12/15 | 5.84 | 0.152 |
| 10:15 AM 12/15 | 5.84 | 0.152 |
| 10:00 AM 12/15 | 5.84 | 0.152 |
| 9:45 AM 12/15 | 5.84 | 0.152 |
| 9:30 AM 12/15 | 5.85 | 0.153 |
18' -
479th Avenue begins to flood south of Castlewood.
17' -
Highway 22 begins to flood, as does 181st Street, and water reaches the bottom of the bridge on 459th Avenue south of Castlewood.
16' -
The river will be about 1 mile wide and many farm buildings around Castlewood will be flooded.
15' -
The water reaches the bottom of the bridges on Highway 22 and 181st Street.
13' -
Major agricultural flooding begins south of Castlewood.
11' -
Significant amounts of pasture and other agricultural lands will be flooded.
10' -
184th Street begins to flood.
9' -
Water overtops the culvert on 184th Street and significant agricultural flooding begins north of Castlewood.
8' -
Minor flooding of low-lying agricultural lands along the river will begin.
| Date | Stage (ft) |
|---|---|
| Apr 7, 1997 | 13.19 |
| Mar 28, 2019 | 12.39 |
| Mar 23, 2011 | 12.29 |
| Apr 8, 2001 | 12.27 |
| Mar 15, 2010 | 11.98 |
| Mar 30, 1986 | 11.73 |
| Mar 14, 1996 | 11.65 |
| Apr 13, 2023 | 11.64 |
| Mar 28, 1993 | 11.39 |
| Mar 13, 1995 | 11.37 |
| Mar 24, 2009 | 11.28 |
| Apr 13, 1979 | 11.23 |
| Mar 16, 1994 | 11.21 |
| Mar 19, 1985 | 11.14 |
| Mar 31, 1978 | 11.1 |
| Jun 22, 1991 | 10.93 |
| Apr 23, 2018 | 10.93 |
| Jun 1, 2022 | 10.7 |
| Jun 16, 1984 | 10.68 |
| Mar 20, 2007 | 10.65 |
Data provided by the National Weather Service.