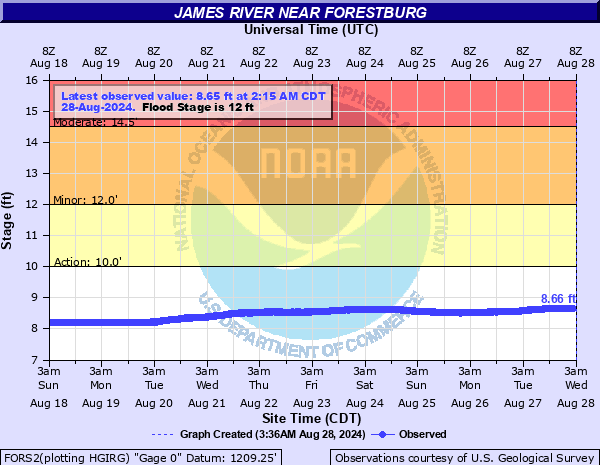
James River near Forestburg
Critical Stages
10' - Action
12' - Flood
14.5' - Moderate
18' - Major
Latest Observation
Updated: 4:15 PM CST 12/15/25
Status: No Flooding
Stage: 6.83 ft
Flow: 0.582 kcfs
Forecast
Forecast not available for this location.
| Time | Stage (ft) | Flow (kcfs) |
|---|---|---|
| 4:15 PM 12/15 | 6.83 | 0.582 |
| 4:00 PM 12/15 | 6.83 | 0.582 |
| 3:45 PM 12/15 | 6.83 | 0.582 |
| 3:30 PM 12/15 | 6.83 | 0.582 |
| 3:15 PM 12/15 | 6.84 | 0.585 |
| 3:00 PM 12/15 | 6.83 | 0.582 |
| 2:45 PM 12/15 | 6.84 | 0.585 |
| 2:30 PM 12/15 | 6.84 | 0.585 |
| 2:15 PM 12/15 | 6.84 | 0.585 |
| 2:00 PM 12/15 | 6.84 | 0.585 |
| 1:45 PM 12/15 | 6.84 | 0.585 |
| 1:30 PM 12/15 | 6.85 | 0.587 |
| 1:15 PM 12/15 | 6.84 | 0.585 |
| 1:00 PM 12/15 | 6.84 | 0.585 |
| 12:45 PM 12/15 | 6.84 | 0.585 |
| 12:30 PM 12/15 | 6.84 | 0.585 |
| 12:15 PM 12/15 | 6.84 | 0.585 |
| 12:00 PM 12/15 | 6.84 | 0.585 |
| 11:45 AM 12/15 | 6.85 | 0.587 |
| 11:30 AM 12/15 | 6.85 | 0.587 |
| 11:15 AM 12/15 | 6.85 | 0.587 |
| 11:00 AM 12/15 | 6.85 | 0.587 |
| 10:45 AM 12/15 | 6.85 | 0.587 |
| 10:30 AM 12/15 | 6.85 | 0.587 |
| 10:15 AM 12/15 | 6.86 | 0.59 |
| 10:00 AM 12/15 | 6.85 | 0.587 |
| 9:45 AM 12/15 | 6.86 | 0.59 |
| 9:30 AM 12/15 | 6.85 | 0.587 |
| 9:15 AM 12/15 | 6.85 | 0.587 |
| 9:00 AM 12/15 | 6.85 | 0.587 |
20' -
405th Ave is flooded and thus most river crossing are impassible resulting in significant travel disruptions.
19' -
Portions of Hwy 34 begin to flood and the bridge on 407th at the gauge is overtopped.
18' -
County Road 21 in northern Davison County will be flooded and water may begin to impact the gauge house.
16' -
Water reaches the bottom of the bridge at the gauge on 407th and the road north of the bridge may be flooded.
14.5' -
Many of the county roads in the area are impassible including 407th, 240th, 241st and 243rd and some roads are under water for as much as 1/2 mile.
13' -
241st St begins to flood where it crosses the river.
12' -
Significant portions of the floodplain begin to flood and a couple county or township roads may begin to flood.
10' -
The lowest banks begin to flood
| Date | Stage (ft) |
|---|---|
| Apr 6, 1997 | 20.61 |
| Mar 25, 2011 | 20.27 |
| Mar 25, 2010 | 19.14 |
| May 8, 2007 | 18.93 |
| Apr 10, 2001 | 18.84 |
| Mar 29, 1920 | 18 |
| Mar 24, 1922 | 18 |
| Apr 25, 2019 | 17.37 |
| Apr 22, 1995 | 17.26 |
| Apr 9, 1969 | 17.16 |
| Mar 31, 1962 | 16.4 |
| Apr 2, 1960 | 16.27 |
| May 14, 2009 | 16.03 |
| May 13, 1986 | 15.76 |
| Jun 25, 1984 | 15.75 |
| Mar 24, 1994 | 15.73 |
| Apr 16, 1952 | 15.46 |
| Mar 12, 2020 | 15.45 |
| Apr 26, 2023 | 15.37 |
| Apr 2, 1978 | 15.24 |
Data provided by the National Weather Service.