Big Sioux River at Watertown Broadway Avenue
Critical Stages
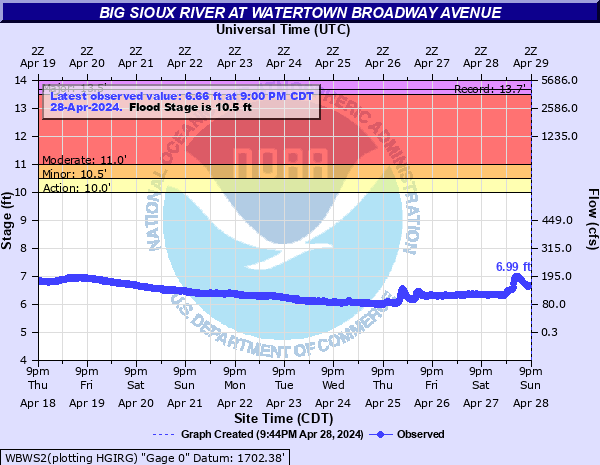
10' - Action
10.5' - Flood
11' - Moderate
13.5' - Major
Latest Observation
Updated: 4:00 PM CST 12/15/25
Status: No Flooding
Stage: 5.73 ft
Flow: -999 kcfs
Forecast
Forecast not available for this location.
| Time | Stage (ft) | Flow (kcfs) |
|---|---|---|
| 5:00 PM 12/15 | 5.75 | -999 |
| 4:45 PM 12/15 | 5.75 | -999 |
| 4:30 PM 12/15 | 5.75 | -999 |
| 4:15 PM 12/15 | 5.74 | -999 |
| 4:00 PM 12/15 | 5.73 | -999 |
| 3:45 PM 12/15 | 5.73 | -999 |
| 3:30 PM 12/15 | 5.73 | -999 |
| 3:15 PM 12/15 | 5.72 | -999 |
| 3:00 PM 12/15 | 5.72 | -999 |
| 2:45 PM 12/15 | 5.72 | -999 |
| 2:30 PM 12/15 | 5.71 | -999 |
| 2:15 PM 12/15 | 5.71 | -999 |
| 2:00 PM 12/15 | 5.71 | -999 |
| 1:45 PM 12/15 | 5.7 | -999 |
| 1:30 PM 12/15 | 5.7 | -999 |
| 1:15 PM 12/15 | 5.7 | -999 |
| 1:00 PM 12/15 | 5.69 | -999 |
| 12:45 PM 12/15 | 5.7 | -999 |
| 12:30 PM 12/15 | 5.69 | -999 |
| 12:15 PM 12/15 | 5.69 | -999 |
| 12:00 PM 12/15 | 5.69 | -999 |
| 11:45 AM 12/15 | 5.69 | -999 |
| 11:30 AM 12/15 | 5.69 | -999 |
| 11:15 AM 12/15 | 5.69 | -999 |
| 11:00 AM 12/15 | 5.69 | -999 |
| 10:45 AM 12/15 | 5.69 | -999 |
| 10:30 AM 12/15 | 5.7 | -999 |
| 10:15 AM 12/15 | 5.69 | -999 |
| 10:00 AM 12/15 | 5.69 | -999 |
| 9:45 AM 12/15 | 5.7 | -999 |
18' -
The bridge on Hwy 81 is overtopped.
17.5' -
The Broadway Avenue bridge at the gauge is overtopped.
17' -
4th Avenue SW begins to flood near Kampeska Blvd.
16.5' -
Broadway Avenue begins to flood.
16' -
The levees on the north side of the river upstream of the gauge are overtopped, and the gas station will begin flooding.
15' -
The railroad upstream of Thunder Road begins to flood, and water reaches the bottom of the bridges on Broadway Ave and 4th Ave SW.
14' -
The levee on the south side of the river upstream from the gauge is overtopped.
11' -
The lower banks on both sides of the river downstream of the gauge are overtopped, and the lower lying areas along Kampeska Blvd, 4th Ave SW, and Riverside Park on Kemp Ave begin to flood.
| Date | Stage (ft) |
|---|---|
| Apr 6, 1997 | 13.67 |
| Apr 7, 2001 | 12.71 |
| Apr 12, 2011 | 11.97 |
| Apr 13, 2023 | 11.87 |
| Mar 28, 2019 | 11.77 |
| Apr 23, 2018 | 11.3 |
| Mar 24, 2010 | 11.07 |
| Mar 24, 2009 | 10.99 |
| May 31, 2022 | 10.65 |
| Mar 22, 2007 | 10.47 |
| Apr 4, 2020 | 9.58 |
| Aug 12, 2016 | 9.35 |
| Jun 22, 2014 | 9.26 |
| Oct 10, 2008 | 9.11 |
| Jun 20, 2012 | 8.93 |
| Mar 31, 2002 | 8.72 |
| Apr 30, 2013 | 8.66 |
| Sep 23, 2017 | 8.61 |
| Mar 13, 2015 | 8.21 |
| Jun 13, 2005 | 8.18 |
Data provided by the National Weather Service.