Connecticut River at Holyoke
Critical Stages
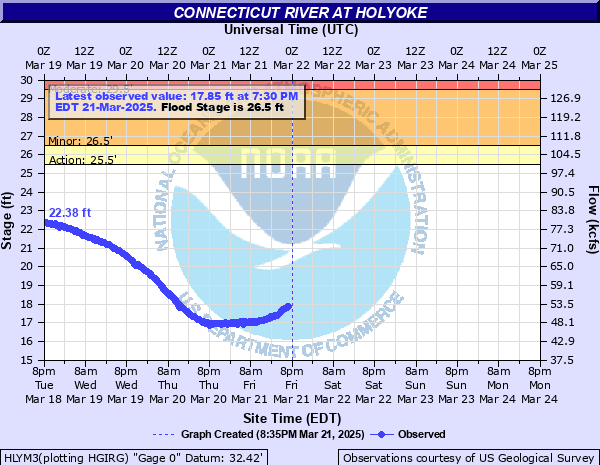
25.5' - Action
26.5' - Flood
29.5' - Moderate
32.5' - Major
Latest Observation
Updated: 10:30 AM EST 12/9/25
Status: No Flooding
Stage: 5.89 ft
Flow: 5.62 kcfs
Forecast
Forecast not available for this location.
| Time | Stage (ft) | Flow (kcfs) |
|---|---|---|
| 11:30 AM 12/9 | 6.16 | 6.26 |
| 11:15 AM 12/9 | 5.98 | 5.84 |
| 11:00 AM 12/9 | 5.93 | 5.72 |
| 10:45 AM 12/9 | 5.92 | 5.69 |
| 10:30 AM 12/9 | 5.89 | 5.62 |
| 10:15 AM 12/9 | 5.84 | 5.51 |
| 10:00 AM 12/9 | 5.76 | 5.32 |
| 9:45 AM 12/9 | 5.67 | 5.12 |
| 9:30 AM 12/9 | 5.64 | 5.05 |
| 9:15 AM 12/9 | 5.62 | 5 |
| 9:00 AM 12/9 | 5.6 | 4.96 |
| 8:45 AM 12/9 | 5.57 | 4.89 |
| 8:30 AM 12/9 | 5.54 | 4.83 |
| 8:15 AM 12/9 | 5.51 | 4.76 |
| 8:00 AM 12/9 | 5.49 | 4.72 |
| 7:45 AM 12/9 | 5.46 | 4.65 |
| 7:30 AM 12/9 | 5.44 | 4.6 |
| 7:15 AM 12/9 | 5.41 | 4.54 |
| 7:00 AM 12/9 | 5.39 | 4.49 |
| 6:46 AM 12/9 | 5.37 | 4.45 |
| 6:45 AM 12/9 | 5.37 | 4.45 |
| 6:30 AM 12/9 | 5.33 | 4.36 |
| 6:15 AM 12/9 | 5.28 | 4.26 |
| 6:00 AM 12/9 | 5.22 | 4.13 |
| 5:45 AM 12/9 | 5.17 | 4.02 |
| 5:30 AM 12/9 | 5.16 | 4 |
| 5:15 AM 12/9 | 5.15 | 3.98 |
| 5:00 AM 12/9 | 5.13 | 3.94 |
| 4:45 AM 12/9 | 5.11 | 3.9 |
| 4:30 AM 12/9 | 5.09 | 3.85 |
32.5' -
This is a serious flood episode. Follow the direction of your local emergency management officals. If asked to evacuate, do so immediately. All flood protection measures must be rushed to completion in flood prone areas. Flooding is likely from below the Holyoke Dam through Chicopee and West Springfield.
29' -
Flooding will continue to spead across low lying areas from Holyoke south through Agawam. Inundation of areas which are outside of local levee protection is likely.
28' -
Flooding will affect low lying areas along the river which fall outside of levees and flood protection walls.
26.5' -
Lowland flooding is expected along the Connecticut River below the Holyoke Dam south to Agawam and Longmeadow.
| Date | Stage (ft) |
|---|---|
| Aug 30, 2011 | 27.73 |
| Oct 10, 2005 | 26.39 |
| Apr 17, 2007 | 25.27 |
| Apr 2, 2004 | 25.2 |
| Apr 4, 2005 | 25.04 |
| Mar 31, 2003 | 22.94 |
| Dec 13, 2008 | 22.06 |
Data provided by the National Weather Service.