Connecticut River at Springfield
Critical Stages
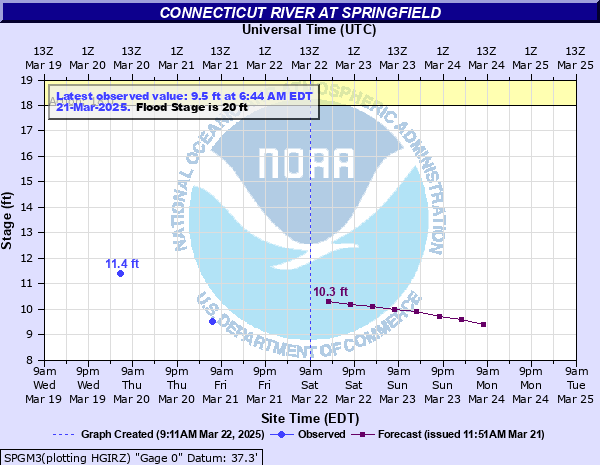
18' - Action
20' - Flood
22' - Moderate
24' - Major
Latest Observation
Updated: 6:04 AM EST 12/9/25
Status: No Flooding
Stage: 1 ft
Flow: 0 kcfs
Forecast
| Time | Stage (ft) | Flow (kcfs) |
|---|---|---|
| 1 PM 12/9 | 1.3 | 0.0019 |
| 7 PM 12/9 | 1.5 | 1.42 |
| 1 AM 12/10 | 1.5 | 1.42 |
| 7 AM 12/10 | 1.5 | 1.42 |
| 1 PM 12/10 | 1.4 | 0.0582 |
| 7 PM 12/10 | 1.2 | 0 |
| 1 AM 12/11 | 1.2 | 0 |
| 7 AM 12/11 | 1.2 | 0 |
| 1 PM 12/11 | 1.2 | 0 |
| 7 PM 12/11 | 1.3 | 0.0019 |
| 1 AM 12/12 | 1.3 | 0.0019 |
| 7 AM 12/12 | 1.3 | 0.0019 |
| Time | Stage (ft) | Flow (kcfs) |
|---|---|---|
| 6:04 AM 12/9 | 1 | 0 |
| 5:00 AM 12/8 | 1.1 | 0 |
| 5:00 AM 12/7 | 1.1 | 0 |
| 5:00 AM 12/6 | 1.1 | 0 |
| 5:00 AM 12/5 | 1 | 0 |
| 6:38 AM 12/4 | 1 | 0 |
| 5:00 AM 12/3 | 1 | 0 |
| 5:00 AM 12/2 | 1 | 0 |
| 5:49 AM 12/1 | 1.7 | 2.1 |
| 6:17 AM 11/30 | 1.7 | 2.1 |
| 5:56 AM 11/28 | 1.4 | 0.0582 |
| 5:28 AM 11/27 | 1.1 | 0 |
| 5:14 AM 11/26 | 1.1 | 0 |
| 5:00 AM 11/24 | 1.1 | 0 |
| 5:11 AM 11/23 | 1 | 0 |
| 3:11 AM 11/22 | 1.4 | 0.0582 |
| 3:27 AM 11/21 | 1 | 0 |
| 5:42 AM 11/20 | 1 | 0 |
| 5:07 AM 11/19 | 1.8 | 2.52 |
| 5:09 AM 11/18 | 2 | 3.5 |
| 5:25 AM 11/17 | 1.4 | 0.0582 |
| 4:38 AM 11/16 | 1.2 | 0 |
| 3:32 AM 11/15 | 1.8 | 2.52 |
| 2:54 AM 11/14 | 2 | 3.5 |
| 4:19 AM 11/13 | 3.2 | 9.47 |
| 5:12 AM 11/12 | 3 | 8.5 |
| 5:05 AM 11/11 | 2.2 | 4.41 |
| 6:30 AM 11/10 | 1.1 | 0 |
24' -
This is a serious flood situation. Action must be taken now to protect life and property. Follow the directions provided by your local emergency management officials. Flooding in Chicopee is likely, outside those areas protected by the levees as well as through Springfield and West Springfield.
21' -
Flooding of low lying sections of West Springfield and Springfield outside of levee protection is expected. Flooding also occurs in lowest lying areas adjacent to the river in Longmeadow and Agawam.
20' -
Lowland flooding in the Market Gardens and Riverdale sections of West Springfield is expected.
| Date | Stage (ft) |
|---|---|
| Mar 20, 1936 | 28.6 |
| Sep 23, 1938 | 25.75 |
| Jun 1, 1984 | 22.65 |
| Nov 6, 1927 | 22.450000762939 |
| Aug 19, 1955 | 21.1 |
| Aug 30, 2011 | 17.58 |
| Oct 10, 2005 | 17 |
| Apr 17, 1996 | 14.800000190735 |
| Jan 19, 1995 | 8.8000001907349 |
Data provided by the National Weather Service.