« Back to Barnard Township Rivers
Mattawamkeag River at Mattawamkeag
Critical Stages
13' - Action
13.5' - Flood
16' - Moderate
17.5' - Major
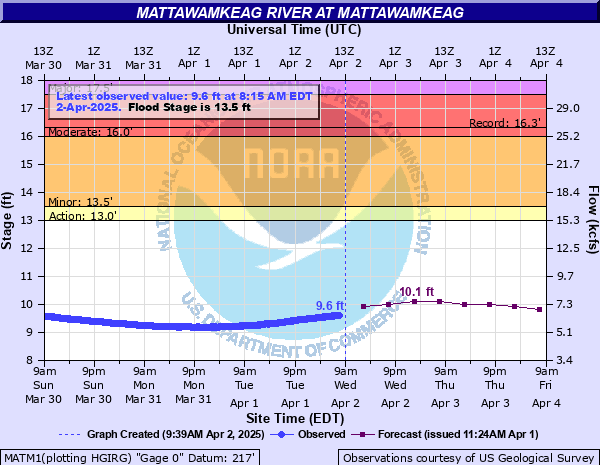
Latest Observation
Updated: 10:15 PM EST 12/14/25
Status: No Flooding
Stage: 5.89 ft
Flow: 1 kcfs
Forecast
| Time | Stage (ft) | Flow (kcfs) |
|---|---|---|
| 1 AM 12/15 | 5.2 | 0.563 |
| 7 AM 12/15 | 5.1 | 0.511 |
| 1 PM 12/15 | 5.1 | 0.511 |
| 7 PM 12/15 | 5.1 | 0.511 |
| 1 AM 12/16 | 5.1 | 0.511 |
| 7 AM 12/16 | 5.1 | 0.511 |
| 1 PM 12/16 | 5.1 | 0.511 |
| 7 PM 12/16 | 5.1 | 0.511 |
| 1 AM 12/17 | 5.1 | 0.511 |
| 7 AM 12/17 | 5.1 | 0.511 |
| Time | Stage (ft) | Flow (kcfs) |
|---|---|---|
| 10:15 PM 12/14 | 5.89 | 1 |
| 10:00 PM 12/14 | 5.89 | 1 |
| 9:45 PM 12/14 | 5.89 | 1 |
| 9:30 PM 12/14 | 5.89 | 1 |
| 9:15 PM 12/14 | 5.89 | 1 |
| 9:00 PM 12/14 | 5.89 | 1 |
| 8:45 PM 12/14 | 5.89 | 1 |
| 8:30 PM 12/14 | 5.89 | 1 |
| 8:15 PM 12/14 | 5.89 | 1 |
| 8:00 PM 12/14 | 5.89 | 1 |
| 7:45 PM 12/14 | 5.88 | 0.997 |
| 7:30 PM 12/14 | 5.89 | 1 |
| 7:15 PM 12/14 | 5.88 | 0.997 |
| 7:00 PM 12/14 | 5.89 | 1 |
| 6:45 PM 12/14 | 5.89 | 1 |
| 6:30 PM 12/14 | 5.89 | 1 |
| 6:15 PM 12/14 | 5.89 | 1 |
| 6:00 PM 12/14 | 5.89 | 1 |
| 5:45 PM 12/14 | 5.89 | 1 |
| 5:30 PM 12/14 | 5.89 | 1 |
| 5:15 PM 12/14 | 5.89 | 1 |
| 5:00 PM 12/14 | 5.9 | 1.01 |
| 4:45 PM 12/14 | 5.9 | 1.01 |
| 4:30 PM 12/14 | 5.9 | 1.01 |
| 4:15 PM 12/14 | 5.91 | 1.02 |
| 4:00 PM 12/14 | 5.91 | 1.02 |
| 3:45 PM 12/14 | 5.92 | 1.03 |
| 3:30 PM 12/14 | 5.93 | 1.04 |
| 3:15 PM 12/14 | 5.93 | 1.04 |
| 3:00 PM 12/14 | 5.93 | 1.04 |
16' -
River Road in Mattawamkeag inundated. Lancaster Road and Kingman Road in Kingman inundated closed to traffic. Bancroft Road in Bancroft inundated and closed. New Brunswick Southern Railroad tracks flooded due to backwater near the confluence of Molunkus Stream into the Mattawamkeag.
15.5' -
Flooding along River Road, Mattawamkeag Wilderness Park Road in Mattawamkeag and Lancaster Road in Kingman.
15' -
Bridge Road near Haynesville flooded.
14' -
Flooding along the Bancroft Road between Wytopitlock and Bancroft.
13.5' -
Minor lowland flooding occurs near River Road and Mattawamkeag Wilderness Park Road.
13' -
River approaches bankfull.
| Date | Stage (ft) |
|---|---|
| Apr 18, 2014 | 16.31 |
| Apr 15, 1993 | 16.16 |
| Apr 14, 1993 | 15.93 |
| Apr 24, 2019 | 15.81 |
| Apr 19, 1994 | 15.73 |
| Apr 30, 2018 | 15.65 |
| Mar 23, 1936 | 15.34 |
| Dec 16, 2010 | 15.18 |
| Dec 2, 1989 | 15.05 |
| Apr 9, 2009 | 14.73 |
| Apr 6, 1976 | 14.7 |
| Apr 25, 2008 | 14.42 |
| Apr 16, 2020 | 14.29 |
| Apr 27, 2007 | 14.04 |
| Apr 2, 2010 | 13.72 |
| Nov 19, 2006 | 13.2 |
| Dec 21, 2023 | 12.23 |
| Apr 12, 2022 | 12.14 |
| Nov 19, 2007 | 11.72 |
| Oct 21, 2022 | 10.88 |
Data provided by the National Weather Service.