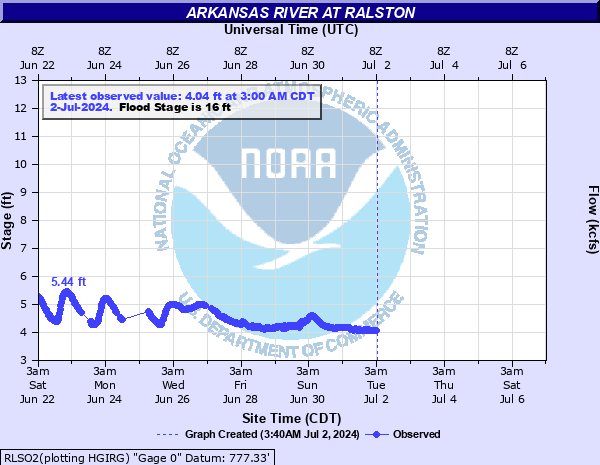
Arkansas River at Ralston
Critical Stages
16' - Action
16' - Flood
18' - Moderate
21' - Major
Latest Observation
Updated: 12:00 PM CST 12/15/25
Status: No Flooding
Stage: 5.73 ft
Flow: 4.01 kcfs
Forecast
Forecast not available for this location.
| Time | Stage (ft) | Flow (kcfs) |
|---|---|---|
| 12:00 PM 12/15 | 5.73 | 4.01 |
| 11:30 AM 12/15 | 5.72 | 3.98 |
| 11:00 AM 12/15 | 5.7 | 3.92 |
| 10:30 AM 12/15 | 5.71 | 3.95 |
| 10:00 AM 12/15 | 5.71 | 3.95 |
| 9:30 AM 12/15 | 5.73 | 4.01 |
| 9:00 AM 12/15 | 5.69 | 3.89 |
| 8:30 AM 12/15 | 5.73 | 4.01 |
| 8:00 AM 12/15 | 5.72 | 3.98 |
| 7:30 AM 12/15 | 5.74 | 4.04 |
| 7:00 AM 12/15 | 5.73 | 4.01 |
| 6:30 AM 12/15 | 5.73 | 4.01 |
| 6:00 AM 12/15 | 5.77 | 4.13 |
| 5:30 AM 12/15 | 5.77 | 4.13 |
| 5:00 AM 12/15 | 5.78 | 4.16 |
| 4:30 AM 12/15 | 5.75 | 4.07 |
| 4:00 AM 12/15 | 5.79 | 4.19 |
| 3:30 AM 12/15 | 5.78 | 4.16 |
| 3:00 AM 12/15 | 5.74 | 4.04 |
| 2:30 AM 12/15 | 5.73 | 4.01 |
| 2:00 AM 12/15 | 5.73 | 4.01 |
| 1:30 AM 12/15 | 5.77 | 4.13 |
| 1:00 AM 12/15 | 5.73 | 4.01 |
| 12:30 AM 12/15 | 5.72 | 3.98 |
| 12:00 AM 12/15 | 5.77 | 4.13 |
| 11:30 PM 12/14 | 5.77 | 4.13 |
| 11:00 PM 12/14 | 5.77 | 4.13 |
| 10:30 PM 12/14 | 5.78 | 4.16 |
| 10:00 PM 12/14 | 5.78 | 4.16 |
| 9:30 PM 12/14 | 5.79 | 4.19 |
24' -
very severe flooding occurs. The Ralston sewage treatment plant levees may be overtopped when the stage reaches 24 feet. This is an extremely dangerous and life threatening situation.
22' -
severe agricultural flooding occurs. Water levels are within 2 feet of topping the Ralston sewage treatment levees when the stage reaches 22 feet. This is a dangerous situation.
21' -
severe agricultural flooding occurs. Water levels need to be patrolled as the levees around the Ralston sewage treatment plant are topped when the stage reaches 24 feet. This is a dangerous situation.
20' -
severe agricultural flooding occurs. The levee around the Ralston sewage treatment plant may need to be patrolled.
18' -
moderate inundation of farmlands occurs mainly along the north bank.
16' -
minor agricultural flooding occurs on the north bank.
| Date | Stage (ft) |
|---|---|
| Jun 11, 1923 | 23 |
| Oct 13, 1973 | 22.98 |
| Apr 25, 1944 | 22.82 |
| Nov 18, 1964 | 22.6 |
| Nov 15, 1964 | 22.6 |
| Oct 4, 1986 | 22.2 |
| May 23, 2019 | 22.14 |
| May 26, 2019 | 22.03 |
| May 25, 2019 | 21.99 |
| Oct 5, 1959 | 21.62 |
| Jul 3, 1951 | 21.45 |
| May 20, 1957 | 21.41 |
| May 8, 1961 | 21.22 |
| Jul 16, 1951 | 20.28 |
| Jul 1, 1957 | 19.88 |
| May 12, 1993 | 19.69 |
| Apr 19, 1945 | 19.55 |
| Oct 2, 1945 | 19.48 |
| Mar 12, 1973 | 19.41 |
| May 21, 2019 | 19.26 |
Data provided by the National Weather Service.