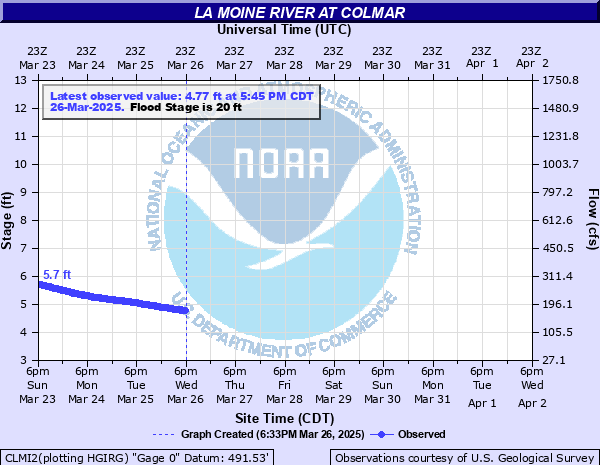
La Moine River at Colmar
Critical Stages
19' - Action
20' - Flood
22' - Moderate
24' - Major
Latest Observation
Updated: 6:45 AM CST 12/6/25
Status: No Flooding
Stage: 3.22 ft
Flow: 0.0427 kcfs
Forecast
Forecast not available for this location.
| Time | Stage (ft) | Flow (kcfs) |
|---|---|---|
| 6:45 AM 12/6 | 3.22 | 0.0427 |
| 6:30 AM 12/6 | 3.22 | 0.0427 |
| 6:15 AM 12/6 | 3.23 | 0.0435 |
| 6:00 AM 12/6 | 3.24 | 0.0444 |
| 5:45 AM 12/6 | 3.24 | 0.0444 |
| 5:30 AM 12/6 | 3.24 | 0.0444 |
| 5:15 AM 12/6 | 3.25 | 0.0453 |
| 5:00 AM 12/6 | 3.25 | 0.0453 |
| 4:45 AM 12/6 | 3.26 | 0.0462 |
| 4:30 AM 12/6 | 3.26 | 0.0462 |
| 4:15 AM 12/6 | 3.26 | 0.0462 |
| 4:00 AM 12/6 | 3.26 | 0.0462 |
| 3:45 AM 12/6 | 3.26 | 0.0462 |
| 3:30 AM 12/6 | 3.26 | 0.0462 |
| 3:15 AM 12/6 | 3.25 | 0.0453 |
| 3:00 AM 12/6 | 3.25 | 0.0453 |
| 2:45 AM 12/6 | 3.26 | 0.0462 |
| 2:30 AM 12/6 | 3.25 | 0.0453 |
| 2:15 AM 12/6 | 3.24 | 0.0444 |
| 2:00 AM 12/6 | 3.24 | 0.0444 |
| 1:45 AM 12/6 | 3.24 | 0.0444 |
| 1:30 AM 12/6 | 3.24 | 0.0444 |
| 1:15 AM 12/6 | 3.23 | 0.0435 |
| 1:00 AM 12/6 | 3.23 | 0.0435 |
| 12:45 AM 12/6 | 3.23 | 0.0435 |
| 12:30 AM 12/6 | 3.22 | 0.0427 |
| 12:15 AM 12/6 | 3.21 | 0.0418 |
| 12:00 AM 12/6 | 3.21 | 0.0418 |
| 11:45 PM 12/5 | 3.2 | 0.041 |
| 11:30 PM 12/5 | 3.2 | 0.041 |
32' -
Water is over the Illinois Highway 61 bridge railings at Colmar.
29.5' -
Water affects Illinois Highway 61 near the La Moine River bridge.
28.5' -
Water is at the bottom of the U.S. Highway 136 bridge deck near Tennessee.
28' -
Water is at the bottom of the Illinois Highway 101 bridge deck at Brooklyn.
27.2' -
Water is at the bottom of the North 270th Road bridge deck.
27' -
Water is at the bottom of the Camp Creek Road bridge deck at Birmingham. Water also affects some houses east of Plymouth.
26.5' -
Water is at the bottom of the Illinois Highway 61 and County Road 26 bridge decks.
25.5' -
Water is at the bottom of the County Road 6 bridge deck near Saint Mary.
24' -
Water affects a few houses near the McDonough and Schuyler county line.
22.5' -
Water affects lower roads around Birmingham.
20' -
Water affects the lowest portions of Lambert Road and affects Lamar Road approximately 100 feet north of the intersection with County Road 26.
| Date | Stage (ft) |
|---|---|
| Apr 19, 2013 | 28.94 |
| Jan 3, 1965 | 27.03 |
| Mar 5, 1985 | 26.61 |
| May 13, 2002 | 25.76 |
| Oct 4, 1986 | 25.69 |
| Sep 25, 1970 | 25.14 |
| May 17, 2009 | 25.06 |
| Jun 21, 1990 | 24.81 |
| Jun 4, 1980 | 24.79 |
| Jun 16, 2011 | 24.59 |
| Jul 5, 1981 | 24.35 |
| Jul 26, 1993 | 24.23 |
| May 28, 1996 | 24.21 |
| May 5, 2013 | 24.08 |
| Jul 21, 2010 | 24.07 |
| May 26, 2019 | 24.06 |
| May 18, 1995 | 23.9 |
| Dec 4, 1982 | 23.82 |
| Jul 27, 1948 | 23.75 |
| Feb 22, 2014 | 23.74 |
Data provided by the National Weather Service.