« Back to Berrien County Rivers
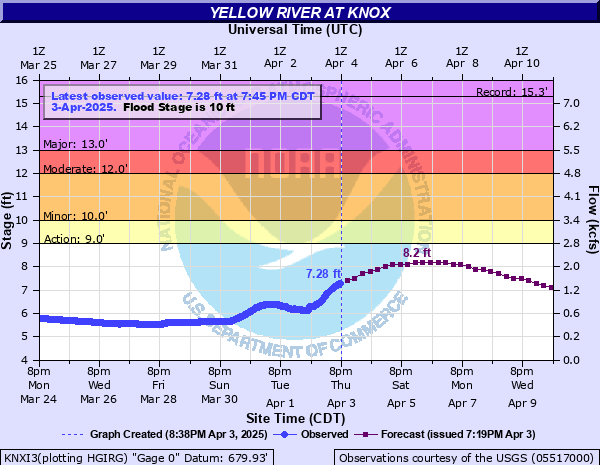
Yellow River at Knox
Critical Stages
9' - Action
10' - Flood
12' - Moderate
13' - Major
Latest Observation
Updated: 12:45 AM CST 12/15/25
Status: No Flooding
Stage: 5.14 ft
Flow: 0.207 kcfs
Forecast
Forecast not available for this location.
| Time | Stage (ft) | Flow (kcfs) |
|---|---|---|
| 1:45 AM 12/15 | 5.14 | 0.207 |
| 1:30 AM 12/15 | 5.14 | 0.207 |
| 1:15 AM 12/15 | 5.14 | 0.207 |
| 1:00 AM 12/15 | 5.14 | 0.207 |
| 12:45 AM 12/15 | 5.14 | 0.207 |
| 12:30 AM 12/15 | 5.14 | 0.207 |
| 12:15 AM 12/15 | 5.14 | 0.207 |
| 12:00 AM 12/15 | 5.17 | 0.216 |
| 11:45 PM 12/14 | 5.17 | 0.216 |
| 11:30 PM 12/14 | 5.17 | 0.216 |
| 11:15 PM 12/14 | 5.17 | 0.216 |
| 11:00 PM 12/14 | 5.17 | 0.216 |
| 10:45 PM 12/14 | 5.17 | 0.216 |
| 10:30 PM 12/14 | 5.17 | 0.216 |
| 10:15 PM 12/14 | 5.17 | 0.216 |
| 10:00 PM 12/14 | 5.17 | 0.216 |
| 9:45 PM 12/14 | 5.17 | 0.216 |
| 9:30 PM 12/14 | 5.17 | 0.216 |
| 9:15 PM 12/14 | 5.17 | 0.216 |
| 9:00 PM 12/14 | 5.17 | 0.216 |
| 8:45 PM 12/14 | 5.17 | 0.216 |
| 8:30 PM 12/14 | 5.21 | 0.228 |
| 8:15 PM 12/14 | 5.21 | 0.228 |
| 8:00 PM 12/14 | 5.21 | 0.228 |
| 7:45 PM 12/14 | 5.21 | 0.228 |
| 7:30 PM 12/14 | 5.21 | 0.228 |
| 7:15 PM 12/14 | 5.22 | 0.231 |
| 7:00 PM 12/14 | 5.22 | 0.231 |
| 6:45 PM 12/14 | 5.22 | 0.231 |
| 6:30 PM 12/14 | 5.22 | 0.231 |
14' -
Flooding closes county roads and state routes 8, 17, and 23. Flood water surrounds residences on the north side of Knox.
12' -
Local roads and state highways 8, 17, and 23 begin to flood.
10' -
Agricultural land and Wythogan City Park begin to flood.
| Date | Stage (ft) |
|---|---|
| Jan 1, 1991 | 15.3 |
| Feb 24, 2018 | 13.81 |
| Oct 15, 1954 | 13.75 |
| Oct 13, 1990 | 13.38 |
| Mar 18, 1982 | 13.25 |
| Mar 12, 2009 | 12.19 |
| Feb 9, 2008 | 12.16 |
| Feb 28, 1985 | 12.15 |
| Mar 26, 1978 | 11.48 |
| Jan 16, 2005 | 11.44 |
| Jan 8, 1993 | 11.16 |
| Jul 22, 1996 | 11.03 |
| Feb 12, 2001 | 10.66 |
| Jun 15, 1981 | 10.53 |
| Feb 25, 1997 | 10.46 |
| Apr 7, 1950 | 10.42 |
| Mar 8, 1979 | 10.33 |
| Jan 9, 1998 | 10.22 |
| May 15, 2002 | 10.2 |
| Apr 26, 1999 | 10.08 |
Data provided by the National Weather Service.