« Back to Berrien Springs Rivers
Kalamazoo River near New Richmond
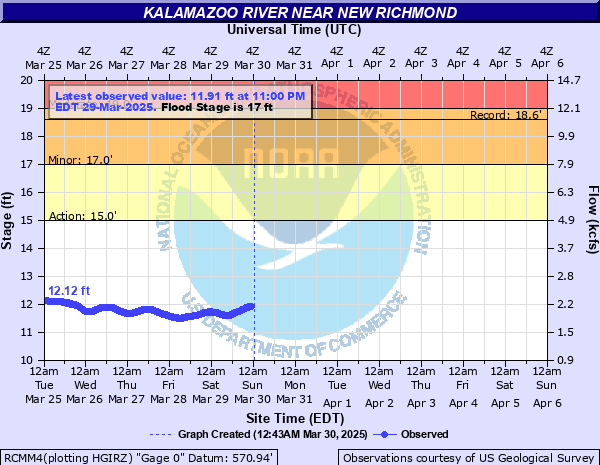
Critical Stages
15' - Action
17' - Flood
19' - Moderate
21' - Major
Latest Observation
Updated: 9:00 PM EST 12/15/25
Status: No Flooding
Stage: 12.62 ft
Flow: 2.63 kcfs
Forecast
Forecast not available for this location.
| Time | Stage (ft) | Flow (kcfs) |
|---|---|---|
| 9:00 PM 12/15 | 12.62 | 2.63 |
| 8:45 PM 12/15 | 12.63 | 2.63 |
| 8:30 PM 12/15 | 12.64 | 2.64 |
| 8:15 PM 12/15 | 12.65 | 2.64 |
| 8:00 PM 12/15 | 12.66 | 2.65 |
| 7:45 PM 12/15 | 12.66 | 2.65 |
| 7:30 PM 12/15 | 12.67 | 2.66 |
| 7:15 PM 12/15 | 12.68 | 2.66 |
| 7:00 PM 12/15 | 12.69 | 2.67 |
| 6:45 PM 12/15 | 12.7 | 2.67 |
| 6:30 PM 12/15 | 12.7 | 2.67 |
| 6:15 PM 12/15 | 12.71 | 2.68 |
| 6:00 PM 12/15 | 12.71 | 2.68 |
| 5:45 PM 12/15 | 12.72 | 2.69 |
| 5:30 PM 12/15 | 12.73 | 2.69 |
| 5:15 PM 12/15 | 12.73 | 2.69 |
| 5:00 PM 12/15 | 12.74 | 2.7 |
| 4:45 PM 12/15 | 12.74 | 2.7 |
| 4:30 PM 12/15 | 12.75 | 2.7 |
| 4:15 PM 12/15 | 12.76 | 2.71 |
| 4:00 PM 12/15 | 12.76 | 2.71 |
| 3:45 PM 12/15 | 12.77 | 2.72 |
| 3:30 PM 12/15 | 12.78 | 2.72 |
| 3:15 PM 12/15 | 12.79 | 2.73 |
| 3:00 PM 12/15 | 12.79 | 2.73 |
| 2:45 PM 12/15 | 12.79 | 2.73 |
| 2:30 PM 12/15 | 12.8 | 2.73 |
| 2:15 PM 12/15 | 12.81 | 2.74 |
| 2:00 PM 12/15 | 12.82 | 2.74 |
| 1:45 PM 12/15 | 12.82 | 2.74 |
21' -
Expect major flooding of low lying areas and farmland along the river.
19' -
Expect moderate flooding of low lying areas and farmland along the river. Considerable flooding of boat launch and trails along the river.
17' -
Expect minor flooding of low lying areas and farmland along the river. Boardwalk along the river and boat launch would be flooded.
15' -
River is bankfull and begins to spill over into large swampy areas along the river. Boardwalk along the river would become flooded.
| Date | Stage (ft) |
|---|---|
| Apr 20, 2013 | 18.58 |
| Feb 23, 2018 | 18.3 |
| Apr 7, 2023 | 17.4 |
| Jun 29, 2021 | 17.29 |
| May 20, 2020 | 16.7 |
| Feb 8, 2019 | 16.57 |
| Apr 29, 2011 | 16.51 |
| Jun 23, 2019 | 16.36 |
| Apr 8, 2017 | 15.91 |
| Jan 29, 2024 | 15.69 |
| Feb 24, 2022 | 15.61 |
| Jun 26, 2015 | 15.55 |
| Mar 24, 2014 | 15.18 |
| Aug 20, 2016 | 14.74 |
| Mar 5, 2012 | 14.51 |
| Dec 29, 2008 | 13.26 |
| Sep 17, 2008 | 12.27 |
| Jan 15, 2005 | 10.55 |
| Jun 18, 2010 | 10.35 |
| May 25, 2004 | 10.01 |
Data provided by the National Weather Service.