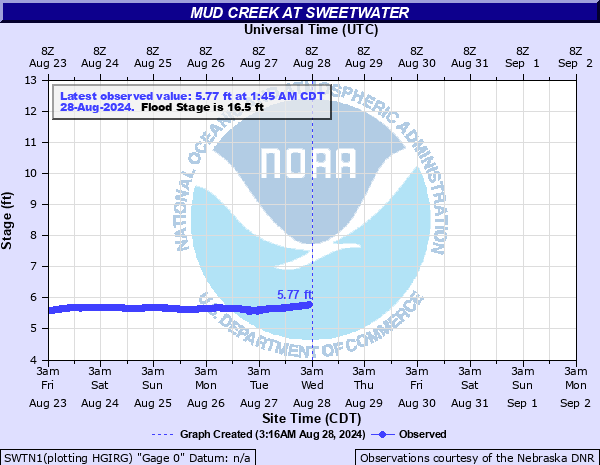
Mud Creek at Sweetwater
Critical Stages
15' - Action
16.5' - Flood
18' - Moderate
21' - Major
Latest Observation
Updated: 1:45 PM CST 12/15/25
Status: No Flooding
Stage: 6.17 ft
Flow: 0.0398 kcfs
Forecast
Forecast not available for this location.
| Time | Stage (ft) | Flow (kcfs) |
|---|---|---|
| 2:45 PM 12/15 | 6.19 | 0.0406 |
| 2:30 PM 12/15 | 6.18 | 0.0402 |
| 2:15 PM 12/15 | 6.18 | 0.0402 |
| 2:00 PM 12/15 | 6.18 | 0.0402 |
| 1:45 PM 12/15 | 6.17 | 0.0398 |
| 1:30 PM 12/15 | 6.17 | 0.0398 |
| 1:15 PM 12/15 | 6.17 | 0.0398 |
| 1:00 PM 12/15 | 6.17 | 0.0398 |
| 12:45 PM 12/15 | 6.17 | 0.0398 |
| 12:30 PM 12/15 | 6.17 | 0.0398 |
| 12:15 PM 12/15 | 6.17 | 0.0398 |
| 12:00 PM 12/15 | 6.17 | 0.0398 |
| 11:45 AM 12/15 | 6.17 | 0.0398 |
| 11:30 AM 12/15 | 6.17 | 0.0398 |
| 11:15 AM 12/15 | 6.16 | 0.0394 |
| 11:00 AM 12/15 | 6.16 | 0.0394 |
| 10:45 AM 12/15 | 6.16 | 0.0394 |
| 10:30 AM 12/15 | 6.15 | 0.039 |
| 10:15 AM 12/15 | 6.16 | 0.0394 |
| 10:00 AM 12/15 | 6.17 | 0.0398 |
| 8:45 AM 12/15 | 6.16 | 0.0394 |
| 8:30 AM 12/15 | 6.14 | 0.0386 |
| 8:15 AM 12/15 | 6.11 | 0.0374 |
| 8:00 AM 12/15 | 6.11 | 0.0374 |
| 7:45 AM 12/15 | 6.11 | 0.0374 |
| 7:30 AM 12/15 | 6.1 | 0.037 |
| 7:15 AM 12/15 | 6.11 | 0.0374 |
| 7:00 AM 12/15 | 6.12 | 0.0378 |
| 6:45 AM 12/15 | 6.12 | 0.0378 |
| 6:30 AM 12/15 | 6.12 | 0.0378 |
21.88' -
Floodwaters begin to impact the bottom of the bridge at the gage site. Highway 2 will be under water and closed in several locations between Hazard and Ravenna.
21' -
The railroad bridge near the site acts as a dam at 20.5 feet which will result in backwater. Highway 2 will be underwater between Hazard and Ravenna in several locations.
20' -
Widespread flooding occurs in agricultural land adjacent to the river. Highway 2 will be inundated between Hazard and Sweetwater. Access to Ravenna from the south will be cut off as Highway 68 will be under water. A house downstream of the gauge house on Keystone Road will begin to flood.
18' -
There will be widespread lowland flooding and Highway 68 access to Ravenna will be under water. In addition, water may encroach on Highway 2 between Hazard and Sweetwater.
16.5' -
Flooding occurs in pastures and agricultural land.
| Date | Stage (ft) |
|---|---|
| Jun 22, 1947 | 23.2 |
| Mar 14, 2019 | 21.95 |
| Jun 24, 1968 | 20.07 |
| Mar 7, 1993 | 19.5 |
| Feb 25, 2007 | 19.1 |
| Mar 9, 1993 | 18.95 |
| Jun 12, 1984 | 18.9 |
| Jun 18, 1962 | 17.93 |
| Mar 16, 1978 | 17.88 |
| Jun 2, 1973 | 17.79 |
| Mar 16, 1948 | 17.7 |
| Jun 18, 1957 | 17.27 |
| Jul 1, 1964 | 16.99 |
| Jun 14, 1967 | 16.85 |
| Jun 17, 1954 | 16.66 |
| Jul 5, 1998 | 16.65 |
| Jun 30, 1960 | 16.62 |
| Jul 19, 1958 | 16.58 |
| Jun 26, 2009 | 16.47 |
| May 16, 1992 | 16.1 |
Data provided by the National Weather Service.