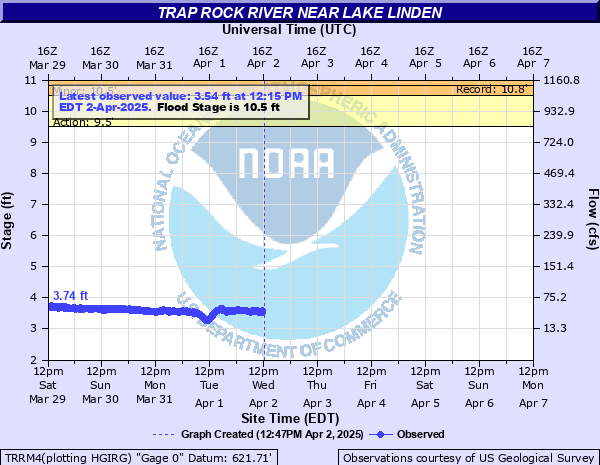
Trap Rock River near Lake Linden
Critical Stages
9.5' - Action
10.5' - Flood
12' - Moderate
13.5' - Major
Latest Observation
Updated: 7:15 PM EST 12/8/25
Status: No Flooding
Stage: 3.62 ft
Flow: 0.0543 kcfs
Forecast
Forecast not available for this location.
| Time | Stage (ft) | Flow (kcfs) |
|---|---|---|
| 7:15 PM 12/8 | 3.62 | 0.0543 |
| 7:00 PM 12/8 | 3.62 | 0.0543 |
| 6:45 PM 12/8 | 3.62 | 0.0543 |
| 6:30 PM 12/8 | 3.62 | 0.0543 |
| 6:15 PM 12/8 | 3.62 | 0.0543 |
| 6:00 PM 12/8 | 3.62 | 0.0543 |
| 5:45 PM 12/8 | 3.62 | 0.0543 |
| 5:30 PM 12/8 | 3.62 | 0.0543 |
| 5:15 PM 12/8 | 3.62 | 0.0543 |
| 5:00 PM 12/8 | 3.62 | 0.0543 |
| 4:45 PM 12/8 | 3.62 | 0.0543 |
| 4:30 PM 12/8 | 3.62 | 0.0543 |
| 4:15 PM 12/8 | 3.63 | 0.055 |
| 4:00 PM 12/8 | 3.63 | 0.055 |
| 3:45 PM 12/8 | 3.62 | 0.0543 |
| 3:30 PM 12/8 | 3.63 | 0.055 |
| 3:15 PM 12/8 | 3.62 | 0.0543 |
| 3:00 PM 12/8 | 3.62 | 0.0543 |
| 2:45 PM 12/8 | 3.63 | 0.055 |
| 2:30 PM 12/8 | 3.62 | 0.0543 |
| 2:15 PM 12/8 | 3.62 | 0.0543 |
| 2:00 PM 12/8 | 3.63 | 0.055 |
| 1:45 PM 12/8 | 3.63 | 0.055 |
| 1:30 PM 12/8 | 3.62 | 0.0543 |
| 1:15 PM 12/8 | 3.63 | 0.055 |
| 1:00 PM 12/8 | 3.63 | 0.055 |
| 12:45 PM 12/8 | 3.63 | 0.055 |
| 12:30 PM 12/8 | 3.63 | 0.055 |
| 12:15 PM 12/8 | 3.63 | 0.055 |
| 12:00 PM 12/8 | 3.63 | 0.055 |
12' -
Water begins to impact homes near the bridge on Angman Road. In addition to Cemetery and Angman Roads...sections of Trap Rock Valley and Kiilunen Roads may be impacted
10.5' -
Low lying sections of Cemetery and Angman Roads become inundated. Minor flooding of residential property near the bridge on Angman Road begins...but no homes are known to be impacted at this level
9.5' -
Water reaches the bottom of the bridge on Cemetery Road creating backwater effects at and upstream of the gauging station
8.5' -
Water begins to spill out of banks into low lying areas, but there are no impacts to area structures or bridges.
| Date | Stage (ft) |
|---|---|
| May 9, 2014 | 10.82 |
| May 10, 1979 | 10.72 |
| Apr 30, 2013 | 10.56 |
| Mar 30, 1998 | 10.53 |
| Apr 21, 2001 | 10.39 |
| Nov 16, 1988 | 10.11 |
| Aug 17, 1988 | 9.95 |
| May 12, 2003 | 9.87 |
| Apr 25, 1982 | 9.67 |
| Apr 13, 2015 | 9.65 |
| Oct 10, 2018 | 9.63 |
| Apr 23, 2019 | 9.62 |
| Apr 13, 2023 | 9.6 |
| Apr 19, 2004 | 9.57 |
| Jun 23, 2011 | 9.31 |
| May 2, 1972 | 9.3 |
| Apr 16, 2002 | 9.28 |
| Apr 25, 2022 | 9.26 |
| Apr 13, 2006 | 9.22 |
| Apr 27, 2017 | 9.21 |
Data provided by the National Weather Service.