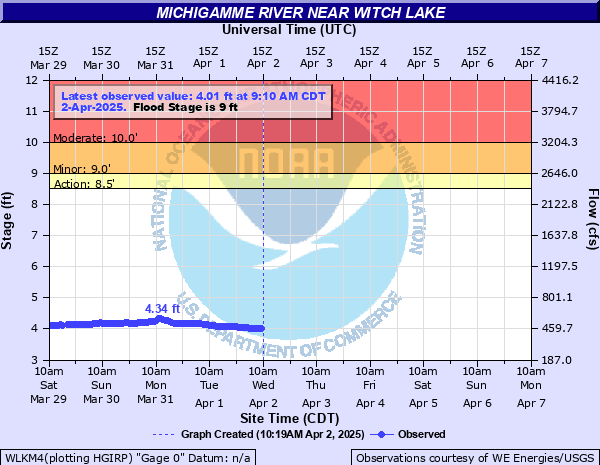
Michigamme River near Witch Lake
Critical Stages
8.5' - Action
9' - Flood
10' - Moderate
12' - Major
Latest Observation
Updated: 6:10 PM CST 12/8/25
Status: No Flooding
Stage: 4.19 ft
Flow: 0.52 kcfs
Forecast
Forecast not available for this location.
| Time | Stage (ft) | Flow (kcfs) |
|---|---|---|
| 6:10 PM 12/8 | 4.19 | 0.52 |
| 5:10 PM 12/8 | 4.19 | 0.52 |
| 4:10 PM 12/8 | 4.2 | 0.523 |
| 3:10 PM 12/8 | 4.21 | 0.526 |
| 2:10 PM 12/8 | 4.21 | 0.526 |
| 1:10 PM 12/8 | 4.22 | 0.53 |
| 12:10 PM 12/8 | 4.23 | 0.533 |
| 11:10 AM 12/8 | 4.22 | 0.53 |
| 10:10 AM 12/8 | 4.22 | 0.53 |
| 9:10 AM 12/8 | 4.21 | 0.526 |
| 8:10 AM 12/8 | 4.21 | 0.526 |
| 7:10 AM 12/8 | 4.2 | 0.523 |
| 6:10 AM 12/8 | 4.19 | 0.52 |
| 5:10 AM 12/8 | 4.19 | 0.52 |
| 4:10 AM 12/8 | 4.2 | 0.523 |
| 3:10 AM 12/8 | 4.21 | 0.526 |
| 2:10 AM 12/8 | 4.22 | 0.53 |
| 1:10 AM 12/8 | 4.24 | 0.536 |
| 12:10 AM 12/8 | 4.24 | 0.536 |
| 11:10 PM 12/7 | 4.24 | 0.536 |
| 10:10 PM 12/7 | 4.23 | 0.533 |
| 9:10 PM 12/7 | 4.21 | 0.526 |
| 8:10 PM 12/7 | 4.19 | 0.52 |
| 7:10 PM 12/7 | 4.17 | 0.513 |
| 6:10 PM 12/7 | 4.15 | 0.507 |
| 5:10 PM 12/7 | 4.15 | 0.507 |
| 4:10 PM 12/7 | 4.18 | 0.516 |
| 3:10 PM 12/7 | 4.21 | 0.526 |
| 2:10 PM 12/7 | 4.25 | 0.539 |
| 1:10 PM 12/7 | 4.28 | 0.549 |
13' -
Homes in Republic near Munson Park...South Republic near Bengtson Bridge...and Witch Lake are significantly flooded. Significant portions of County Roads 601...LG...LE and Newberg road are flooded
11' -
Flood waters cover significant portions of County Road LG between M-95 and Michigamme Dam. Houses near Bengtson Bridge in South Republic are further impacted by flood waters
9' -
Water impacts the yards and a few homes near Bengtson bridge on County Road LI in South Republic and along Floodwood Drive near the Michigamme River east of M-95. Approximately 6 inches of water is covering portions of County Road LG northwest of M-95
8.5' -
Water begins to cover County Road LG 2.6 miles northwest of M-95
8' -
Water inundates low lying areas along the river in Republic and South Republic...and will impact the yards of homes near Bengtson bridge on County Road LI in South Republic
| Date | Stage (ft) |
|---|---|
| Apr 20, 2002 | 13.1 |
| Apr 19, 2023 | 11.97 |
| May 11, 1965 | 11.6 |
| Apr 28, 1979 | 11.22 |
| Apr 21, 1976 | 11.01 |
| Apr 27, 2019 | 11 |
| May 7, 1975 | 9.9 |
| Apr 19, 1967 | 9.85 |
| Apr 22, 2004 | 9.78 |
| May 6, 2013 | 9.58 |
| Apr 24, 1969 | 9.55 |
| Apr 26, 2008 | 9.35 |
| May 13, 2014 | 9.29 |
| Apr 28, 2022 | 8.74 |
| Apr 27, 1966 | 8.63 |
| Apr 26, 2001 | 8.6 |
| Apr 22, 1977 | 8.53 |
| May 3, 1997 | 8.27 |
| May 5, 2020 | 8.02 |
| Apr 17, 2006 | 7.99 |
Data provided by the National Weather Service.