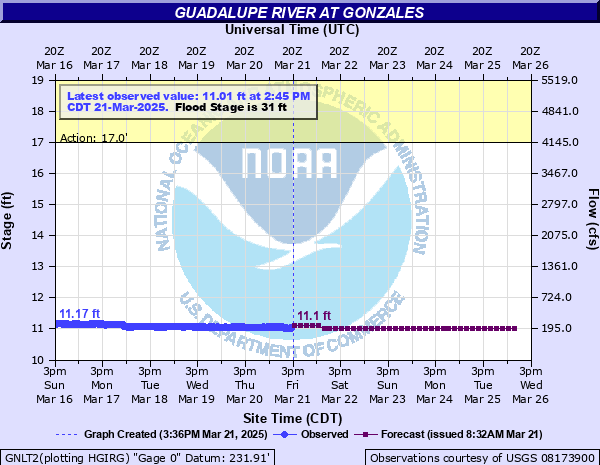
Guadalupe River at Gonzales
Critical Stages
17' - Action
31' - Flood
37' - Moderate
43' - Major
Latest Observation
Updated: 7:45 AM CST 12/6/25
Status: No Flooding
Stage: 11.01 ft
Flow: 0.211 kcfs
Forecast
| Time | Stage (ft) | Flow (kcfs) |
|---|---|---|
| 9 AM 12/6 | 11 | 0.207 |
| 12 PM 12/6 | 11 | 0.207 |
| 3 PM 12/6 | 11 | 0.207 |
| 6 PM 12/6 | 11 | 0.207 |
| 9 PM 12/6 | 11 | 0.207 |
| 12 AM 12/7 | 11 | 0.207 |
| 3 AM 12/7 | 11 | 0.207 |
| 6 AM 12/7 | 11 | 0.207 |
| 9 AM 12/7 | 11 | 0.207 |
| 12 PM 12/7 | 11 | 0.207 |
| 3 PM 12/7 | 11 | 0.207 |
| 6 PM 12/7 | 11 | 0.207 |
| 9 PM 12/7 | 11 | 0.207 |
| 12 AM 12/8 | 11 | 0.207 |
| 3 AM 12/8 | 11 | 0.207 |
| 6 AM 12/8 | 11 | 0.207 |
| 9 AM 12/8 | 11 | 0.207 |
| 12 PM 12/8 | 10.9 | 0.17 |
| 3 PM 12/8 | 10.9 | 0.17 |
| 6 PM 12/8 | 10.9 | 0.17 |
| 9 PM 12/8 | 10.9 | 0.17 |
| 12 AM 12/9 | 10.9 | 0.17 |
| 3 AM 12/9 | 10.9 | 0.17 |
| 6 AM 12/9 | 10.9 | 0.17 |
| 9 AM 12/9 | 10.9 | 0.17 |
| 12 PM 12/9 | 10.9 | 0.17 |
| 3 PM 12/9 | 10.9 | 0.17 |
| 6 PM 12/9 | 10.9 | 0.17 |
| 9 PM 12/9 | 10.9 | 0.17 |
| 12 AM 12/10 | 10.9 | 0.17 |
| 3 AM 12/10 | 10.9 | 0.17 |
| 6 AM 12/10 | 10.9 | 0.17 |
| Time | Stage (ft) | Flow (kcfs) |
|---|---|---|
| 7:45 AM 12/6 | 11.01 | 0.211 |
| 7:30 AM 12/6 | 11.01 | 0.211 |
| 7:15 AM 12/6 | 11.02 | 0.214 |
| 7:00 AM 12/6 | 11.02 | 0.214 |
| 6:45 AM 12/6 | 11.02 | 0.214 |
| 6:30 AM 12/6 | 11.02 | 0.214 |
| 6:15 AM 12/6 | 11.02 | 0.214 |
| 6:00 AM 12/6 | 11.02 | 0.214 |
| 5:45 AM 12/6 | 11.02 | 0.214 |
| 5:30 AM 12/6 | 11.02 | 0.214 |
| 5:15 AM 12/6 | 11.02 | 0.214 |
| 5:00 AM 12/6 | 11.02 | 0.214 |
| 4:45 AM 12/6 | 11.02 | 0.214 |
| 4:30 AM 12/6 | 11.02 | 0.214 |
| 4:15 AM 12/6 | 11.02 | 0.214 |
| 4:00 AM 12/6 | 11.02 | 0.214 |
| 3:45 AM 12/6 | 11.02 | 0.214 |
| 3:30 AM 12/6 | 11.01 | 0.211 |
| 3:15 AM 12/6 | 11.02 | 0.214 |
| 3:00 AM 12/6 | 11.01 | 0.211 |
| 2:45 AM 12/6 | 11.02 | 0.214 |
| 2:30 AM 12/6 | 11.02 | 0.214 |
| 2:15 AM 12/6 | 11.01 | 0.211 |
| 2:00 AM 12/6 | 11.02 | 0.214 |
| 1:45 AM 12/6 | 11.02 | 0.214 |
| 1:30 AM 12/6 | 11.02 | 0.214 |
| 1:15 AM 12/6 | 11.02 | 0.214 |
| 1:00 AM 12/6 | 11.02 | 0.214 |
| 12:45 AM 12/6 | 11.02 | 0.214 |
| 12:30 AM 12/6 | 11.02 | 0.214 |
48' -
Flow passes through the windows of the old power plant. Nearly all of the city park is under several feet of water. The flood plain northwest of town below the Guadalupe-San Marcos Rivers confluence is several miles wide. Lowest homes along miles of Tinsley Creek are flooded as the Guadalupe River backs into it.
45' -
Flow reaches the floor of the old power plant and to the slab of the electric plant. Water is several feet deep in the baseball and concession buildings in the city park. Flooding is several miles wide in the flood plain just northwest of Gonzales. Flow approaches lower homes in the Tinsley Creek flood plain in Gonzales as the Guadalupe River backs up. Any flow down Tinsley Creek over the backflow can flood homes.
43' -
Major flooding closes Highways 183, 97 and Farm to Market 108. Runoff down Tinsley Creek in Gonzales added to the Guadalupe River backwater can flood lowest homes near the creek. Secondary roads and streets near the river are flooded and dangerous to motorists.
40' -
Moderate lowland flooding inundates a large area of pastureland northwest of Gonzales between the Guadalupe and San Marcos Rivers. Flood waters approach the city park storage garage while much of the park in Gonzales is flooded with lowest areas up to 9 feet. Many secondary roads in the flood plain are flooded and closed including CR 197.
37' -
Moderate lowland flooding inundates pasture and cropland between the Guadalupe/San Marcos river confluence and Gonzales. Secondary roads, low bridges and much of the city park and facilities near the river in Gonzales are flooded.
34' -
Pastureland northwest of Gonzales between the Guadalupe and San Marcos Rivers is flooded. Lowest areas of the city park flood.
31' -
Minor lowland flooding begins to enter the Gonzales City Park.
| Date | Stage (ft) |
|---|---|
| Oct 19, 1998 | 50.44 |
| May 29, 1929 | 50.43 |
| Nov 23, 2004 | 44.38 |
| Jul 7, 2002 | 42.64 |
| Aug 28, 2017 | 42.5 |
| May 25, 2015 | 42.13 |
| Nov 1, 2015 | 41.97 |
| Oct 16, 2021 | 40.93 |
| Mar 13, 2007 | 40.53 |
| Jul 22, 2007 | 40.25 |
| Jan 26, 2012 | 39.76 |
| Nov 17, 2001 | 39.19 |
| Jun 24, 1997 | 38.8 |
| Jul 1, 1936 | 38.2 |
| Dec 4, 1913 | 38.1 |
| Jun 11, 2010 | 37.74 |
| Apr 22, 1926 | 36.4 |
| Jul 7, 1942 | 35.1 |
| Dec 22, 1991 | 35.01 |
| Jun 5, 1987 | 34.7 |
Data provided by the National Weather Service.