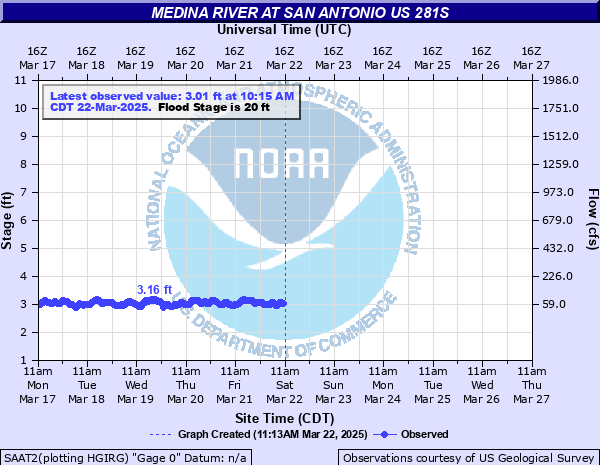
Medina River at San Antonio US 281S
Critical Stages
16' - Action
20' - Flood
24' - Moderate
28' - Major
Latest Observation
Updated: 7:15 AM CST 12/6/25
Status: No Flooding
Stage: 2.84 ft
Flow: 0.0316 kcfs
Forecast
Forecast not available for this location.
| Time | Stage (ft) | Flow (kcfs) |
|---|---|---|
| 7:15 AM 12/6 | 2.84 | 0.0316 |
| 7:00 AM 12/6 | 2.83 | 0.031 |
| 6:45 AM 12/6 | 2.83 | 0.031 |
| 6:30 AM 12/6 | 2.84 | 0.0316 |
| 6:15 AM 12/6 | 2.86 | 0.033 |
| 6:00 AM 12/6 | 2.88 | 0.0345 |
| 5:45 AM 12/6 | 2.89 | 0.0352 |
| 5:30 AM 12/6 | 2.91 | 0.0367 |
| 5:15 AM 12/6 | 2.92 | 0.0375 |
| 5:00 AM 12/6 | 2.93 | 0.0383 |
| 4:45 AM 12/6 | 2.92 | 0.0375 |
| 4:30 AM 12/6 | 2.93 | 0.0383 |
| 4:15 AM 12/6 | 2.91 | 0.0367 |
| 4:00 AM 12/6 | 2.9 | 0.036 |
| 3:45 AM 12/6 | 2.88 | 0.0345 |
| 3:30 AM 12/6 | 2.86 | 0.033 |
| 3:15 AM 12/6 | 2.85 | 0.0323 |
| 3:00 AM 12/6 | 2.84 | 0.0316 |
| 2:45 AM 12/6 | 2.84 | 0.0316 |
| 2:30 AM 12/6 | 2.84 | 0.0316 |
| 2:15 AM 12/6 | 2.85 | 0.0323 |
| 2:00 AM 12/6 | 2.84 | 0.0316 |
| 1:45 AM 12/6 | 2.84 | 0.0316 |
| 1:30 AM 12/6 | 2.84 | 0.0316 |
| 1:15 AM 12/6 | 2.84 | 0.0316 |
| 1:00 AM 12/6 | 2.84 | 0.0316 |
| 12:45 AM 12/6 | 2.85 | 0.0323 |
| 12:30 AM 12/6 | 2.85 | 0.0323 |
| 12:15 AM 12/6 | 2.86 | 0.033 |
| 12:00 AM 12/6 | 2.86 | 0.033 |
28' -
Major flooding puts the Farm to Market 1937 bridge floor under eight feet of water. Flow approaches homes downstream near Losoya. Livestock are cut off and potentiallly drowned in the flood plain.
24' -
Moderate lowland flooding floods secondary roads and bridges making them dangerous to traffic.
20' -
Minor lowland flooding reaches the Farm to Market 1937 bridge floor.
16' -
Overbank conditions with water extending into lowest areas of the flood plain with no significant damage.
| Date | Stage (ft) |
|---|---|
| Jul 4, 2002 | 55.65 |
| Jul 1, 1900 | 55 |
| Oct 18, 1998 | 49.47 |
| Jul 17, 1973 | 43.59 |
| Aug 29, 1946 | 41.57 |
| Jun 5, 1987 | 37.37 |
| May 26, 2013 | 32.37 |
| Jul 1, 1936 | 32.2 |
| Dec 22, 1992 | 30.16 |
| Jun 14, 1981 | 29.04 |
| Jun 23, 1997 | 28.14 |
| Jul 7, 2021 | 27.93 |
| Jun 3, 2016 | 26.62 |
| Nov 17, 2004 | 26.28 |
| Jun 12, 2025 | 25.31 |
| Jun 29, 2007 | 24.96 |
| May 6, 1993 | 23.79 |
| Oct 14, 2021 | 22.77 |
| May 24, 2015 | 20.91 |
Data provided by the National Weather Service.