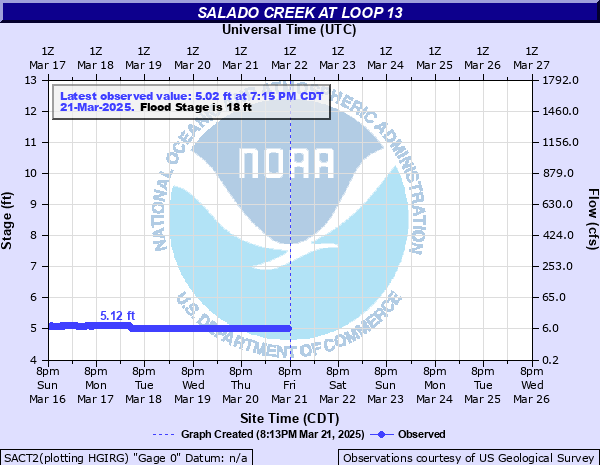
Salado Creek at Loop 13
Critical Stages
15' - Action
18' - Flood
20' - Moderate
22' - Major
Latest Observation
Updated: 7:15 AM CST 12/6/25
Status: No Flooding
Stage: 4.87 ft
Flow: 0.0027 kcfs
Forecast
Forecast not available for this location.
| Time | Stage (ft) | Flow (kcfs) |
|---|---|---|
| 7:15 AM 12/6 | 4.87 | 0.0027 |
| 7:00 AM 12/6 | 4.87 | 0.0027 |
| 6:45 AM 12/6 | 4.87 | 0.0027 |
| 6:30 AM 12/6 | 4.87 | 0.0027 |
| 6:15 AM 12/6 | 4.87 | 0.0027 |
| 6:00 AM 12/6 | 4.87 | 0.0027 |
| 5:45 AM 12/6 | 4.87 | 0.0027 |
| 5:30 AM 12/6 | 4.87 | 0.0027 |
| 5:15 AM 12/6 | 4.87 | 0.0027 |
| 5:00 AM 12/6 | 4.87 | 0.0027 |
| 4:45 AM 12/6 | 4.87 | 0.0027 |
| 4:30 AM 12/6 | 4.87 | 0.0027 |
| 4:15 AM 12/6 | 4.87 | 0.0027 |
| 4:00 AM 12/6 | 4.87 | 0.0027 |
| 3:45 AM 12/6 | 4.87 | 0.0027 |
| 3:30 AM 12/6 | 4.87 | 0.0027 |
| 3:15 AM 12/6 | 4.87 | 0.0027 |
| 3:00 AM 12/6 | 4.87 | 0.0027 |
| 2:45 AM 12/6 | 4.87 | 0.0027 |
| 2:30 AM 12/6 | 4.87 | 0.0027 |
| 2:15 AM 12/6 | 4.87 | 0.0027 |
| 2:00 AM 12/6 | 4.87 | 0.0027 |
| 1:45 AM 12/6 | 4.87 | 0.0027 |
| 1:30 AM 12/6 | 4.87 | 0.0027 |
| 1:15 AM 12/6 | 4.87 | 0.0027 |
| 1:00 AM 12/6 | 4.87 | 0.0027 |
| 12:45 AM 12/6 | 4.87 | 0.0027 |
| 12:30 AM 12/6 | 4.87 | 0.0027 |
| 12:15 AM 12/6 | 4.87 | 0.0027 |
| 12:00 AM 12/6 | 4.87 | 0.0027 |
22' -
Major lowland flooding reaches the Loop 13 bridge floor. Secondary roads, low bridges and access roads are flooded and very dangerous to motorists.
18' -
Minor lowland flooding reaches numerous access and secondary roads and low bridges.
| Date | Stage (ft) |
|---|---|
| Oct 17, 1998 | 34.07 |
| Sep 27, 1973 | 28.83 |
| Jun 4, 1986 | 27.95 |
| Nov 22, 2004 | 27.37 |
| May 6, 1993 | 27.04 |
| Aug 15, 1960 | 26.8 |
| May 26, 2013 | 25.93 |
| Jun 12, 2025 | 24.9 |
| Nov 1, 1977 | 22 |
| Apr 5, 1991 | 21.19 |
| Dec 19, 1992 | 20.74 |
| May 24, 2015 | 20.29 |
| Oct 14, 2021 | 19.27 |
| Apr 25, 2015 | 18.2 |
| Jul 5, 2002 | 17.19 |
Data provided by the National Weather Service.