Cibolo Creek at Selma
Critical Stages
14' - Action
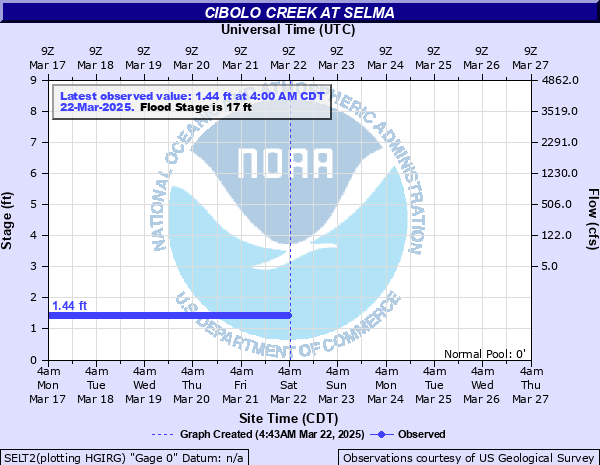
17' - Flood
20' - Moderate
22' - Major
Latest Observation
Updated: 8:00 AM CST 12/6/25
Status: No Flooding
Stage: 1.46 ft
Flow: -999 kcfs
Forecast
Forecast not available for this location.
| Time | Stage (ft) | Flow (kcfs) |
|---|---|---|
| 8:00 AM 12/6 | 1.46 | -999 |
| 7:45 AM 12/6 | 1.46 | -999 |
| 7:30 AM 12/6 | 1.46 | -999 |
| 7:15 AM 12/6 | 1.46 | -999 |
| 7:00 AM 12/6 | 1.46 | -999 |
| 6:45 AM 12/6 | 1.46 | -999 |
| 6:30 AM 12/6 | 1.46 | -999 |
| 6:15 AM 12/6 | 1.46 | -999 |
| 6:00 AM 12/6 | 1.46 | -999 |
| 5:45 AM 12/6 | 1.46 | -999 |
| 5:30 AM 12/6 | 1.46 | -999 |
| 5:15 AM 12/6 | 1.46 | -999 |
| 5:00 AM 12/6 | 1.46 | -999 |
| 4:45 AM 12/6 | 1.46 | -999 |
| 4:30 AM 12/6 | 1.46 | -999 |
| 4:15 AM 12/6 | 1.46 | -999 |
| 4:00 AM 12/6 | 1.46 | -999 |
| 3:45 AM 12/6 | 1.46 | -999 |
| 3:30 AM 12/6 | 1.46 | -999 |
| 3:15 AM 12/6 | 1.46 | -999 |
| 3:00 AM 12/6 | 1.46 | -999 |
| 2:45 AM 12/6 | 1.46 | -999 |
| 2:30 AM 12/6 | 1.46 | -999 |
| 2:15 AM 12/6 | 1.46 | -999 |
| 2:00 AM 12/6 | 1.46 | -999 |
| 1:45 AM 12/6 | 1.46 | -999 |
| 1:30 AM 12/6 | 1.46 | -999 |
| 1:15 AM 12/6 | 1.46 | -999 |
| 1:00 AM 12/6 | 1.46 | -999 |
| 12:45 AM 12/6 | 1.46 | -999 |
31' -
Water reaches the floor of the Highway 78 bridge.
22' -
Major flooding severely floods a trailer park in Schertz. Major lowland flooding damages crop and pasture land below Bulverde to below Falls City, flooding secondary roads and low bridges.
20' -
A trailer park downstream in Schertz floods. Flow approaches lowest businesses and residences in Schertz. Moderate lowland flooding damages crop and pasture land in the flood plain below Bulverde to below Stockdale.
18' -
River has reached the floor of the bridge at the intersection of Lookout Road and North Evans Road near the gauge.
17' -
Minor lowland flooding floods a trailer park downstream in Schertz. Moderate lowland flooding in the flood plain below Bulverde to below Stockdale floods secondary roads and bridges near the creek.
| Date | Stage (ft) |
|---|---|
| Oct 17, 1998 | 35.4 |
| Jun 22, 1997 | 29.73 |
| Jan 1, 1989 | 26 |
| May 12, 1972 | 24.34 |
| Jul 2, 2002 | 22.31 |
| Oct 30, 2015 | 21.93 |
| May 22, 1992 | 20.97 |
| Dec 21, 1991 | 19.83 |
| May 24, 2015 | 19.02 |
| Nov 22, 2004 | 17.36 |
| Jun 12, 2025 | 8.58 |
Data provided by the National Weather Service.