« Back to Black Forest Trail Rivers
Bald Eagle Creek near Beech Creek Station
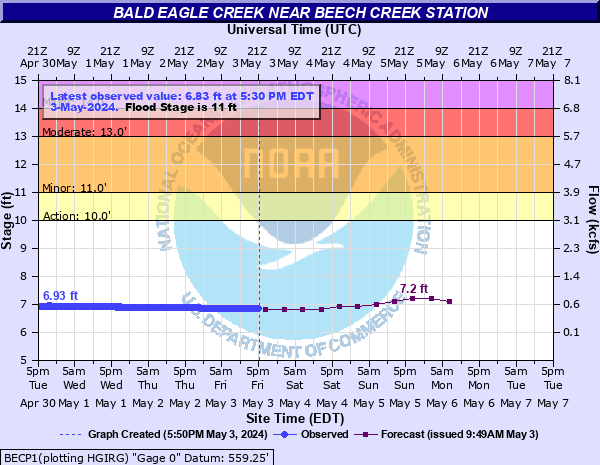
Critical Stages
10' - Action
11' - Flood
13' - Moderate
14' - Major
Latest Observation
Updated: 8:30 AM EST 12/6/25
Status: No Flooding
Stage: 6.54 ft
Flow: 0.26 kcfs
Forecast
| Time | Stage (ft) | Flow (kcfs) |
|---|---|---|
| 1 PM 12/6 | 6.4 | 0.202 |
| 7 PM 12/6 | 6.4 | 0.202 |
| 1 AM 12/7 | 6.4 | 0.202 |
| 7 AM 12/7 | 6.4 | 0.202 |
| 1 PM 12/7 | 6.4 | 0.202 |
| 7 PM 12/7 | 6.4 | 0.202 |
| 1 AM 12/8 | 6.4 | 0.202 |
| 7 AM 12/8 | 6.4 | 0.202 |
| Time | Stage (ft) | Flow (kcfs) |
|---|---|---|
| 8:30 AM 12/6 | 6.54 | 0.26 |
| 8:15 AM 12/6 | 6.53 | 0.255 |
| 8:00 AM 12/6 | 6.53 | 0.255 |
| 7:45 AM 12/6 | 6.53 | 0.255 |
| 7:30 AM 12/6 | 6.53 | 0.255 |
| 7:15 AM 12/6 | 6.53 | 0.255 |
| 7:00 AM 12/6 | 6.53 | 0.255 |
| 6:45 AM 12/6 | 6.53 | 0.255 |
| 6:30 AM 12/6 | 6.53 | 0.255 |
| 6:15 AM 12/6 | 6.53 | 0.255 |
| 6:00 AM 12/6 | 6.53 | 0.255 |
| 5:45 AM 12/6 | 6.53 | 0.255 |
| 5:30 AM 12/6 | 6.53 | 0.255 |
| 5:15 AM 12/6 | 6.53 | 0.255 |
| 5:00 AM 12/6 | 6.52 | 0.251 |
| 4:45 AM 12/6 | 6.53 | 0.255 |
| 4:30 AM 12/6 | 6.52 | 0.251 |
| 4:15 AM 12/6 | 6.52 | 0.251 |
| 4:00 AM 12/6 | 6.52 | 0.251 |
| 3:45 AM 12/6 | 6.52 | 0.251 |
| 3:30 AM 12/6 | 6.52 | 0.251 |
| 3:15 AM 12/6 | 6.52 | 0.251 |
| 3:00 AM 12/6 | 6.52 | 0.251 |
| 2:45 AM 12/6 | 6.52 | 0.251 |
| 2:30 AM 12/6 | 6.52 | 0.251 |
| 2:15 AM 12/6 | 6.52 | 0.251 |
| 2:00 AM 12/6 | 6.52 | 0.251 |
| 1:45 AM 12/6 | 6.52 | 0.251 |
| 1:30 AM 12/6 | 6.52 | 0.251 |
| 1:15 AM 12/6 | 6.52 | 0.251 |
15' -
Homes in the cottage area are cutoff by high water and directly affect homes in this area.
14' -
Homes in the cottage area are cutoff by high water from Bald Eagle Creek.
13' -
Homes in the cottage area are isolated by high water from Bald Eagle Creek.
11' -
High water levels threaten the cottage area of Mill Hall downstream of Beech Creek Station.
10' -
Overgrown pastures and agricultural fields on the left bank are affected by high water.
| Date | Stage (ft) |
|---|---|
| Sep 18, 2004 | 15.97 |
| Jan 19, 1996 | 15.62 |
| Sep 11, 2018 | 15.14 |
| Dec 2, 2010 | 14.57 |
| Mar 18, 1936 | 14.42 |
| Nov 28, 1993 | 14.3 |
| Jun 28, 2013 | 13.75 |
| Jun 17, 1916 | 13.2 |
| Apr 4, 2024 | 12.9 |
| Apr 16, 1993 | 12.76 |
| Sep 9, 2004 | 12.68 |
| Apr 1, 1993 | 12.48 |
| Oct 21, 2016 | 12.41 |
| Apr 28, 2011 | 12.13 |
| Mar 15, 1986 | 11.98 |
| Dec 25, 2020 | 11.77 |
| Nov 30, 2005 | 11.73 |
| Aug 10, 2024 | 11.68 |
| Sep 7, 2011 | 11.66 |
| Sep 28, 2004 | 11.63 |
Data provided by the National Weather Service.