« Back to Black Forest Trail Rivers
West Branch Susquehanna River at Lock Haven
Critical Stages
17' - Action
21' - Flood
23' - Moderate
25' - Major
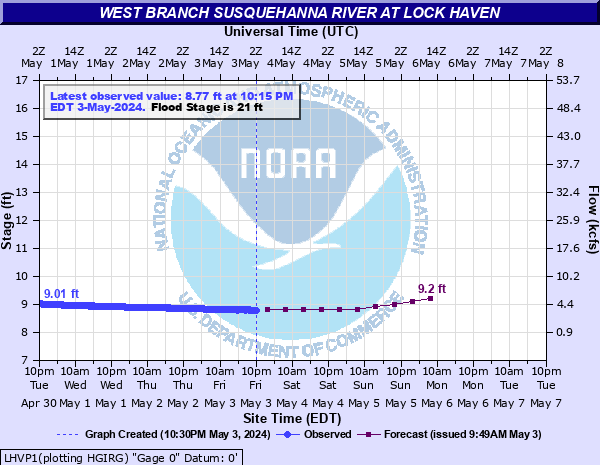
Latest Observation
Updated: 7:15 AM EST 12/6/25
Status: No Flooding
Stage: 8.23 ft
Flow: 1.5 kcfs
Forecast
| Time | Stage (ft) | Flow (kcfs) |
|---|---|---|
| 1 PM 12/6 | 8.2 | 1.42 |
| 7 PM 12/6 | 8.2 | 1.42 |
| 1 AM 12/7 | 8.2 | 1.42 |
| 7 AM 12/7 | 8.2 | 1.42 |
| 1 PM 12/7 | 8.2 | 1.42 |
| 7 PM 12/7 | 8.2 | 1.42 |
| 1 AM 12/8 | 8.2 | 1.42 |
| 7 AM 12/8 | 8.2 | 1.42 |
| Time | Stage (ft) | Flow (kcfs) |
|---|---|---|
| 8:15 AM 12/6 | 8.23 | 1.5 |
| 8:00 AM 12/6 | 8.23 | 1.5 |
| 7:45 AM 12/6 | 8.23 | 1.5 |
| 7:30 AM 12/6 | 8.23 | 1.5 |
| 7:15 AM 12/6 | 8.23 | 1.5 |
| 7:00 AM 12/6 | 8.23 | 1.5 |
| 6:45 AM 12/6 | 8.23 | 1.5 |
| 6:30 AM 12/6 | 8.23 | 1.5 |
| 6:15 AM 12/6 | 8.23 | 1.5 |
| 6:00 AM 12/6 | 8.23 | 1.5 |
| 5:45 AM 12/6 | 8.24 | 1.53 |
| 5:30 AM 12/6 | 8.24 | 1.53 |
| 5:15 AM 12/6 | 8.24 | 1.53 |
| 5:00 AM 12/6 | 8.25 | 1.56 |
| 4:45 AM 12/6 | 8.25 | 1.56 |
| 4:30 AM 12/6 | 8.25 | 1.56 |
| 4:15 AM 12/6 | 8.26 | 1.59 |
| 4:00 AM 12/6 | 8.26 | 1.59 |
| 3:45 AM 12/6 | 8.27 | 1.62 |
| 3:30 AM 12/6 | 8.27 | 1.62 |
| 3:15 AM 12/6 | 8.27 | 1.62 |
| 3:00 AM 12/6 | 8.24 | 1.53 |
| 2:45 AM 12/6 | 8.23 | 1.5 |
| 2:30 AM 12/6 | 8.23 | 1.5 |
| 2:15 AM 12/6 | 8.23 | 1.5 |
| 2:00 AM 12/6 | 8.23 | 1.5 |
| 1:45 AM 12/6 | 8.22 | 1.48 |
| 1:30 AM 12/6 | 8.22 | 1.48 |
| 1:15 AM 12/6 | 8.22 | 1.48 |
| 1:00 AM 12/6 | 8.23 | 1.5 |
39.5' -
Approximate level of the FEMA 0.2 0X0P+0nnual Chance Flood level (500-year flood).
35.5' -
Flood waters begin to reach teh Woodward Avenue Bridge.
34.5' -
Flood waters begin to reach the North Jay Street Bridge.
33.5' -
Approximate level of the FEMA 1 0X0P+0nnual Chance Flood level (100-year flood).
32.5' -
Flood of record from 1936. Flood waters begin to reach teh railroad bridge crossing the river near Farrandsville.
31' -
Approximate level of the FEMA 2 0X0P+0nnual Chance Flood level (50-year flood).
30.5' -
Flood waters begin to reach the first Island Road Bridge.
27' -
Approximately 75 percent of Lock Haven would be inundated if the levee system was not in place.
25' -
Numerous homes and businesses would be flooded if the levee system was not in place. Approximate level of the FEMA 10 0X0P+0nnual Chance Flood level (10-year flood).
23' -
Considerable flooding would occur if the levee system was not in place.
21' -
The right, or south bank overflows in areas not protected by the levee system.
19' -
River interests should monitor conditions for continued rising water levels.
17' -
River interests should monitor conditions for continued rising water levels. Historically, at these levels, homes downstream along the antes creek are affected.
| Date | Stage (ft) |
|---|---|
| Mar 18, 1936 | 32.3 |
| Jun 23, 1972 | 31.1 |
| Jun 1, 1889 | 29.8 |
| Sep 18, 2004 | 28.13 |
| Nov 26, 1950 | 27.61 |
| May 28, 1946 | 26.85 |
| Feb 21, 1918 | 26.8 |
| Mar 24, 1898 | 26.4 |
| Mar 10, 1964 | 26.1 |
| Jan 20, 1996 | 25.860000610352 |
| Mar 4, 1923 | 25.1 |
| Nov 4, 1904 | 24.2 |
| Mar 4, 1904 | 24.2 |
| Dec 2, 2010 | 24.1 |
| Mar 1, 1902 | 23.7 |
| Dec 31, 1942 | 23.1 |
| Sep 26, 1975 | 22.92 |
| Feb 26, 1926 | 22.8 |
| Feb 15, 1984 | 22.38 |
| Sep 11, 2018 | 21.93 |
Data provided by the National Weather Service.