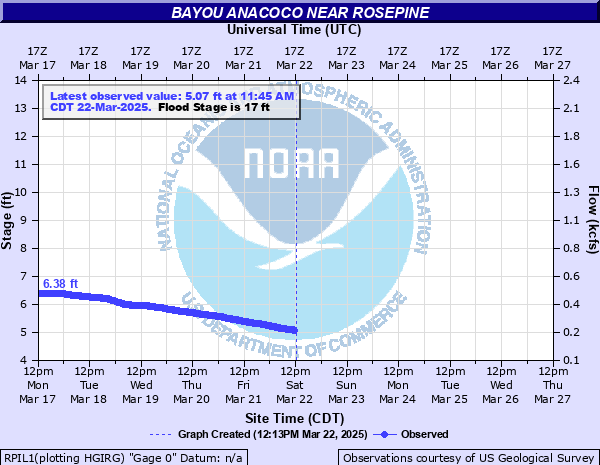
Bayou Anacoco near Rosepine
Critical Stages
17' - Action
17' - Flood
21' - Moderate
24' - Major
Latest Observation
Updated: 5:45 AM CST 12/8/25
Status: No Flooding
Stage: 3.82 ft
Flow: 0.0649 kcfs
Forecast
Forecast not available for this location.
| Time | Stage (ft) | Flow (kcfs) |
|---|---|---|
| 5:45 AM 12/8 | 3.82 | 0.0649 |
| 5:30 AM 12/8 | 3.82 | 0.0649 |
| 5:15 AM 12/8 | 3.82 | 0.0649 |
| 5:00 AM 12/8 | 3.82 | 0.0649 |
| 4:45 AM 12/8 | 3.82 | 0.0649 |
| 4:30 AM 12/8 | 3.82 | 0.0649 |
| 4:15 AM 12/8 | 3.83 | 0.0659 |
| 4:00 AM 12/8 | 3.83 | 0.0659 |
| 3:45 AM 12/8 | 3.83 | 0.0659 |
| 3:30 AM 12/8 | 3.83 | 0.0659 |
| 3:15 AM 12/8 | 3.83 | 0.0659 |
| 3:00 AM 12/8 | 3.84 | 0.0669 |
| 2:45 AM 12/8 | 3.84 | 0.0669 |
| 2:30 AM 12/8 | 3.84 | 0.0669 |
| 2:15 AM 12/8 | 3.84 | 0.0669 |
| 2:00 AM 12/8 | 3.84 | 0.0669 |
| 1:45 AM 12/8 | 3.85 | 0.0678 |
| 1:30 AM 12/8 | 3.85 | 0.0678 |
| 1:15 AM 12/8 | 3.85 | 0.0678 |
| 1:00 AM 12/8 | 3.85 | 0.0678 |
| 12:45 AM 12/8 | 3.85 | 0.0678 |
| 12:30 AM 12/8 | 3.86 | 0.0689 |
| 12:15 AM 12/8 | 3.86 | 0.0689 |
| 12:00 AM 12/8 | 3.86 | 0.0689 |
| 11:45 PM 12/7 | 3.86 | 0.0689 |
| 11:30 PM 12/7 | 3.87 | 0.0699 |
| 11:15 PM 12/7 | 3.87 | 0.0699 |
| 11:00 PM 12/7 | 3.87 | 0.0699 |
| 10:45 PM 12/7 | 3.87 | 0.0699 |
| 10:30 PM 12/7 | 3.87 | 0.0699 |
28.38' -
The bayou is at its highest level recorded.
27.8' -
This level is similiar to that reached during the late december 1982 flood event.
24.25' -
This level is similiar to that reached during tropical storm Allison of 1989.
24' -
Major flood damage along the bayou begins at this level. Highway 1211 and many secondary roads are closed.
22' -
Water covers highway 1211 upstream of the gage.
21' -
Moderate flood damage along the bayou begins at this level.
20' -
Hawks Road near the gauge becomes flooded.
17' -
Minor flooding of agricultural and forested areas near the bayou will occur.
| Date | Stage (ft) |
|---|---|
| May 11, 2016 | 29.01 |
| May 19, 1953 | 28.38 |
| Dec 28, 1982 | 27.8 |
| Aug 31, 2017 | 27.21 |
| Feb 11, 1966 | 26.05 |
| Aug 4, 1955 | 25.24 |
| Nov 20, 1957 | 24.67 |
| Jun 29, 1989 | 24.26 |
| Feb 13, 1984 | 23.86 |
| Dec 14, 2001 | 23.65 |
| Apr 24, 1952 | 23.61 |
| Jan 28, 1994 | 23.51 |
| May 5, 1975 | 23.4 |
| Nov 25, 1986 | 23.36 |
| Nov 2, 2015 | 23.32 |
| May 30, 2018 | 23.25 |
| Oct 11, 2020 | 23.02 |
| Nov 25, 2004 | 22.53 |
| Oct 19, 2006 | 22.48 |
| Jan 21, 1990 | 22.39 |
Data provided by the National Weather Service.