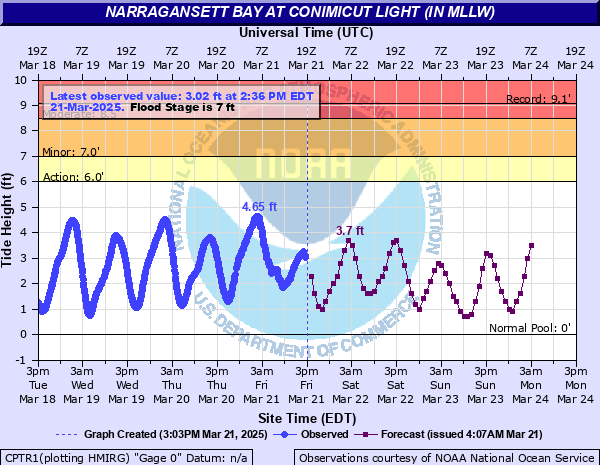
Narragansett Bay at Conimicut Light (IN MLLW)
Critical Stages
6' - Action
7' - Flood
8.5' - Moderate
10' - Major
Latest Observation
Updated: 4:06 PM EST 12/7/25
Status: No Flooding
Stage: 1.08 ft
Flow: -999 kcfs
Forecast
| Time | Stage (ft) | Flow (kcfs) |
|---|---|---|
| 5 PM 12/7 | 1.1 | -999 |
| 6 PM 12/7 | 1.5 | -999 |
| 7 PM 12/7 | 2.4 | -999 |
| 8 PM 12/7 | 3.4 | -999 |
| 9 PM 12/7 | 4.4 | -999 |
| 10 PM 12/7 | 4.9 | -999 |
| 11 PM 12/7 | 4.5 | -999 |
| 12 AM 12/8 | 3.4 | -999 |
| 1 AM 12/8 | 2 | -999 |
| 2 AM 12/8 | 0.8 | -999 |
| 3 AM 12/8 | 0.1 | -999 |
| 4 AM 12/8 | -0.1 | -999 |
| 5 AM 12/8 | 0.1 | -999 |
| 6 AM 12/8 | 0.6 | -999 |
| 7 AM 12/8 | 1.4 | -999 |
| 8 AM 12/8 | 2.4 | -999 |
| 9 AM 12/8 | 3.5 | -999 |
| 10 AM 12/8 | 4.2 | -999 |
| 11 AM 12/8 | 4.4 | -999 |
| 12 PM 12/8 | 3.9 | -999 |
| 1 PM 12/8 | 3 | -999 |
| 2 PM 12/8 | 2 | -999 |
| 3 PM 12/8 | 1.2 | -999 |
| 4 PM 12/8 | 0.9 | -999 |
| 5 PM 12/8 | 0.9 | -999 |
| 6 PM 12/8 | 1.1 | -999 |
| 7 PM 12/8 | 1.6 | -999 |
| 8 PM 12/8 | 2.3 | -999 |
| 9 PM 12/8 | 3.4 | -999 |
| 10 PM 12/8 | 4.3 | -999 |
| 11 PM 12/8 | 4.7 | -999 |
| 12 AM 12/9 | 4.3 | -999 |
| 1 AM 12/9 | 3.3 | -999 |
| 2 AM 12/9 | 2 | -999 |
| 3 AM 12/9 | 1.2 | -999 |
| 4 AM 12/9 | 0.7 | -999 |
| 5 AM 12/9 | 0.7 | -999 |
| 6 AM 12/9 | 1.1 | -999 |
| 7 AM 12/9 | 1.5 | -999 |
| 8 AM 12/9 | 2.1 | -999 |
| 9 AM 12/9 | 3 | -999 |
| 10 AM 12/9 | 4 | -999 |
| 11 AM 12/9 | 4.7 | -999 |
| 12 PM 12/9 | 4.8 | -999 |
| 1 PM 12/9 | 4.1 | -999 |
| 2 PM 12/9 | 3.2 | -999 |
| 3 PM 12/9 | 2.3 | -999 |
| 4 PM 12/9 | 1.6 | -999 |
| 5 PM 12/9 | 1.3 | -999 |
| 6 PM 12/9 | 1.4 | -999 |
| 7 PM 12/9 | 1.5 | -999 |
| 8 PM 12/9 | 2 | -999 |
| 9 PM 12/9 | 2.7 | -999 |
| 10 PM 12/9 | 3.8 | -999 |
| 11 PM 12/9 | 4.6 | -999 |
| 12 AM 12/10 | 4.9 | -999 |
| 1 AM 12/10 | 4.5 | -999 |
| 2 AM 12/10 | 3.3 | -999 |
| 3 AM 12/10 | 1.9 | -999 |
| 4 AM 12/10 | 0.9 | -999 |
| 5 AM 12/10 | 0.3 | -999 |
| 6 AM 12/10 | 0.5 | -999 |
| 7 AM 12/10 | 0.8 | -999 |
| 8 AM 12/10 | 1.1 | -999 |
| 9 AM 12/10 | 1.7 | -999 |
| 10 AM 12/10 | 2.6 | -999 |
| 11 AM 12/10 | 3.5 | -999 |
| 12 PM 12/10 | 4.1 | -999 |
| 1 PM 12/10 | 4.4 | -999 |
| 2 PM 12/10 | 4 | -999 |
| 3 PM 12/10 | 3.3 | -999 |
| Time | Stage (ft) | Flow (kcfs) |
|---|---|---|
| 4:18 PM 12/7 | 1.07 | -999 |
| 4:12 PM 12/7 | 1.08 | -999 |
| 4:06 PM 12/7 | 1.08 | -999 |
| 4:00 PM 12/7 | 1.07 | -999 |
| 3:54 PM 12/7 | 1.08 | -999 |
| 3:48 PM 12/7 | 1.06 | -999 |
| 3:42 PM 12/7 | 1.05 | -999 |
| 3:36 PM 12/7 | 1 | -999 |
| 3:30 PM 12/7 | 0.98 | -999 |
| 3:24 PM 12/7 | 0.96 | -999 |
| 3:18 PM 12/7 | 0.93 | -999 |
| 3:12 PM 12/7 | 0.88 | -999 |
| 3:06 PM 12/7 | 0.84 | -999 |
| 3:00 PM 12/7 | 0.83 | -999 |
| 2:54 PM 12/7 | 0.8 | -999 |
| 2:48 PM 12/7 | 0.76 | -999 |
| 2:42 PM 12/7 | 0.73 | -999 |
| 2:36 PM 12/7 | 0.74 | -999 |
| 2:30 PM 12/7 | 0.76 | -999 |
| 2:24 PM 12/7 | 0.77 | -999 |
| 2:18 PM 12/7 | 0.78 | -999 |
| 2:12 PM 12/7 | 0.81 | -999 |
| 2:06 PM 12/7 | 0.87 | -999 |
| 2:00 PM 12/7 | 0.92 | -999 |
| 1:54 PM 12/7 | 0.94 | -999 |
| 1:48 PM 12/7 | 1.01 | -999 |
| 1:42 PM 12/7 | 1.08 | -999 |
| 1:36 PM 12/7 | 1.16 | -999 |
| 1:30 PM 12/7 | 1.24 | -999 |
| 1:24 PM 12/7 | 1.33 | -999 |
10' -
Major coastal flooding is expected in Warwick, Bristol, Barrington and Warren. Numerous homes, businesses and roadways near the coastline will be impacted by this event. In Warwick, flooding occurs in and around Oakland Beach, Strand Ave, Goddard Memorial State Park, and Sandy Point. In Bristol impacts occur in the vicinity of Bristol Harbor, Route 114 and Colt State Park. In Barrington and Warren, flooding occurs along the Warren and Barrington Rivers, near Belchers Cove and the Kickemuit River.
9' -
Moderate to major flooding is expected in the vicinity of Warwick, Barrington, Bristol and Warren. This includes but is not limited to the following. In Warwick, flooding occurs in and around Oakland Beach, Strand Ave, Goddard Memorial State Park, and Sandy Point. In Bristol, impacts occur in the vicinity of Bristol Harbor, Route 114, Colt State Park and the East Bay Bike Path. In Barrington and Warren, flooding occurs along the Warren and Barrington Rivers, near Belchers Cove and the Kickemuit River.
8' -
Minor to moderate coastal flooding is expected within Warwick, Barrington, Bristol and Warren. This includings low lying roads and some homes and businesses nearshore. Heed the advice of local officals, and evacuate if asked to do so.
7' -
Minor coastal flooding is expected in the lowest lying areas of Warwick, Barrington, Bristol and Warren. Low lying coastal roads flood around high tide. Floodwaters encroach on lowest lying homes and businesses.
| Date | Stage (ft) |
|---|---|
| Oct 29, 2012 | 9.06 |
| Dec 18, 2023 | 8.52 |
| Dec 23, 2022 | 8.45 |
| Jan 13, 2024 | 7.89 |
| Aug 28, 2011 | 7.56 |
| Jan 28, 2024 | 7.54 |
| Mar 10, 2024 | 7.32 |
| Dec 12, 2000 | 7.29 |
| Feb 9, 2016 | 7.23 |
| Dec 3, 2009 | 7.22 |
| Sep 30, 2015 | 7.07 |
| Mar 31, 2010 | 7.01 |
| Jun 5, 2012 | 7.01 |
| Mar 2, 2010 | 7 |
| Apr 19, 2007 | 7 |
| Nov 6, 2002 | 6.98 |
| Oct 29, 2003 | 6.98 |
| Dec 9, 2009 | 6.96 |
| Jan 31, 2006 | 6.75 |
| Apr 3, 2005 | 6.72 |
Data provided by the National Weather Service.