Missouri River at Gavins Point Dam
Critical Stages
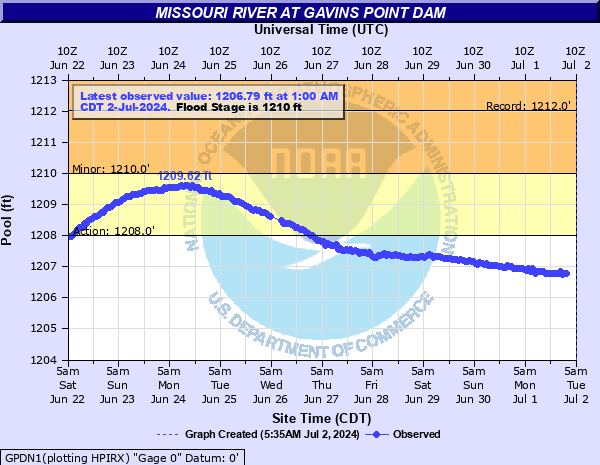
1208' - Action
1210' - Flood
1221' - Moderate
1234' - Major
Latest Observation
Updated: 9:00 PM CST 12/14/25
Status: No Flooding
Stage: 1207.87 ft
Flow: -999 kcfs
Forecast
Forecast not available for this location.
| Time | Stage (ft) | Flow (kcfs) |
|---|---|---|
| 9:00 PM 12/14 | 1207.87 | -999 |
| 8:00 PM 12/14 | 1207.87 | -999 |
| 7:00 PM 12/14 | 1207.91 | -999 |
| 6:00 PM 12/14 | 1207.91 | -999 |
| 5:00 PM 12/14 | 1207.91 | -999 |
| 4:00 PM 12/14 | 1207.91 | -999 |
| 3:00 PM 12/14 | 1207.92 | -999 |
| 2:00 PM 12/14 | 1207.92 | -999 |
| 1:00 PM 12/14 | 1207.92 | -999 |
| 12:00 PM 12/14 | 1207.94 | -999 |
| 11:00 AM 12/14 | 1207.94 | -999 |
| 10:00 AM 12/14 | 1207.92 | -999 |
| 9:00 AM 12/14 | 1207.94 | -999 |
| 8:00 AM 12/14 | 1207.91 | -999 |
| 7:00 AM 12/14 | 1207.94 | -999 |
| 6:00 AM 12/14 | 1207.92 | -999 |
| 5:00 AM 12/14 | 1207.91 | -999 |
| 4:00 AM 12/14 | 1207.92 | -999 |
| 3:00 AM 12/14 | 1207.91 | -999 |
| 2:00 AM 12/14 | 1207.91 | -999 |
| 1:00 AM 12/14 | 1207.91 | -999 |
| 12:00 AM 12/14 | 1207.87 | -999 |
| 11:00 PM 12/13 | 1207.91 | -999 |
| 10:00 PM 12/13 | 1207.87 | -999 |
| 9:00 PM 12/13 | 1207.87 | -999 |
| 8:00 PM 12/13 | 1207.87 | -999 |
| 7:00 PM 12/13 | 1207.87 | -999 |
| 6:00 PM 12/13 | 1207.87 | -999 |
| 5:00 PM 12/13 | 1207.87 | -999 |
| 4:00 PM 12/13 | 1207.85 | -999 |
1234' -
Top of dam elevation.
1221.4' -
Elevation at maximum spillway design discharge capacity.
1210' -
Maximum operating pool.
1208' -
Base of the exclusive flood control zone.
1204.5' -
Base flood control elevation.
1180' -
Spillway crest elevation.
| Date | Stage (ft) |
|---|---|
| Mar 15, 2019 | 1212.02 |
| Apr 1, 1960 | 1210.6 |
| Jun 1, 2010 | 1209.7 |
| Jun 24, 2024 | 1209.6 |
| May 30, 1995 | 1209.23 |
| Feb 1, 2007 | 1209.2 |
| Mar 1, 1978 | 1209.2 |
| Oct 1, 1979 | 1209.2 |
| Dec 1, 1975 | 1209.1 |
| Nov 1, 1982 | 1209 |
| Nov 1, 2001 | 1209 |
| Jan 1, 1980 | 1208.9 |
| Nov 1, 1983 | 1208.9 |
| Oct 1, 1991 | 1208.9 |
| Oct 1, 1977 | 1208.8 |
| Dec 1, 1976 | 1208.8 |
| Jan 1, 1974 | 1208.8 |
| Jan 1, 1987 | 1208.8 |
| Sep 1, 1986 | 1208.8 |
| Jan 1, 1981 | 1208.8 |
Data provided by the National Weather Service.