North Fork Elkhorn River near Pierce
Critical Stages
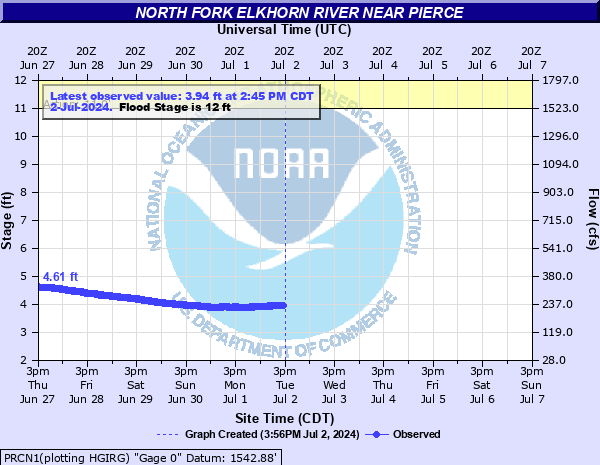
11' - Action
12' - Flood
14' - Moderate
16' - Major
Latest Observation
Updated: 8:45 PM CST 12/14/25
Status: No Flooding
Stage: 2.84 ft
Flow: 0.0985 kcfs
Forecast
Forecast not available for this location.
| Time | Stage (ft) | Flow (kcfs) |
|---|---|---|
| 8:45 PM 12/14 | 2.84 | 0.0985 |
| 8:40 PM 12/14 | 2.83 | 0.0976 |
| 8:35 PM 12/14 | 2.81 | 0.0959 |
| 8:30 PM 12/14 | 2.8 | 0.095 |
| 8:25 PM 12/14 | 2.78 | 0.0932 |
| 8:20 PM 12/14 | 2.77 | 0.0922 |
| 8:15 PM 12/14 | 2.76 | 0.0913 |
| 8:10 PM 12/14 | 2.75 | 0.0904 |
| 7:45 PM 12/14 | 2.78 | 0.0932 |
| 7:40 PM 12/14 | 2.77 | 0.0922 |
| 7:35 PM 12/14 | 2.76 | 0.0913 |
| 7:30 PM 12/14 | 2.75 | 0.0904 |
| 7:25 PM 12/14 | 2.75 | 0.0904 |
| 7:20 PM 12/14 | 2.74 | 0.0895 |
| 7:15 PM 12/14 | 2.73 | 0.0886 |
| 7:10 PM 12/14 | 2.72 | 0.0878 |
| 6:45 PM 12/14 | 2.75 | 0.0904 |
| 6:40 PM 12/14 | 2.74 | 0.0895 |
| 6:35 PM 12/14 | 2.73 | 0.0886 |
| 6:30 PM 12/14 | 2.72 | 0.0878 |
| 6:25 PM 12/14 | 2.71 | 0.0869 |
| 6:20 PM 12/14 | 2.7 | 0.086 |
| 6:15 PM 12/14 | 2.69 | 0.0851 |
| 6:10 PM 12/14 | 2.69 | 0.0851 |
| 5:45 PM 12/14 | 2.71 | 0.0869 |
| 5:40 PM 12/14 | 2.7 | 0.086 |
| 5:35 PM 12/14 | 2.69 | 0.0851 |
| 5:30 PM 12/14 | 2.69 | 0.0851 |
| 5:25 PM 12/14 | 2.68 | 0.0841 |
| 5:20 PM 12/14 | 2.68 | 0.0841 |
20' -
Water overtops the bridge at the gage site.
19' -
The levee may be overtopped causing widespread flooding throughout the reach.
16.5' -
Water reaches the bottom of the bridge at the gage site.
15' -
Flood waters rise up against the federal levee protecting Pierce. Sandbagging and other protective operations are started.
14.5' -
Water nears the toe of the levee in Norfolk.
14' -
The access road to the river gage site is flooded.
12' -
Widespread lowland flooding occurs.
| Date | Stage (ft) |
|---|---|
| Mar 14, 2019 | 17.34 |
| Feb 19, 1971 | 15.1 |
| Mar 28, 1962 | 14.9 |
| May 27, 1980 | 14.63 |
| Jun 19, 1967 | 14.49 |
| Jun 13, 2010 | 14.21 |
| Jul 30, 1968 | 14.16 |
| Feb 9, 1966 | 14.1 |
| Jul 26, 1972 | 14.08 |
| Mar 19, 1978 | 13.95 |
| Jun 25, 1969 | 13.81 |
| Mar 10, 1993 | 13.64 |
| Oct 9, 2017 | 13.36 |
| Aug 5, 1996 | 13.2 |
| Jun 22, 1984 | 13.15 |
| Sep 2, 2021 | 13.15 |
| May 31, 1982 | 13.14 |
| Mar 5, 2018 | 13.1 |
| Jul 13, 1994 | 12.97 |
| Mar 18, 1986 | 12.93 |
Data provided by the National Weather Service.